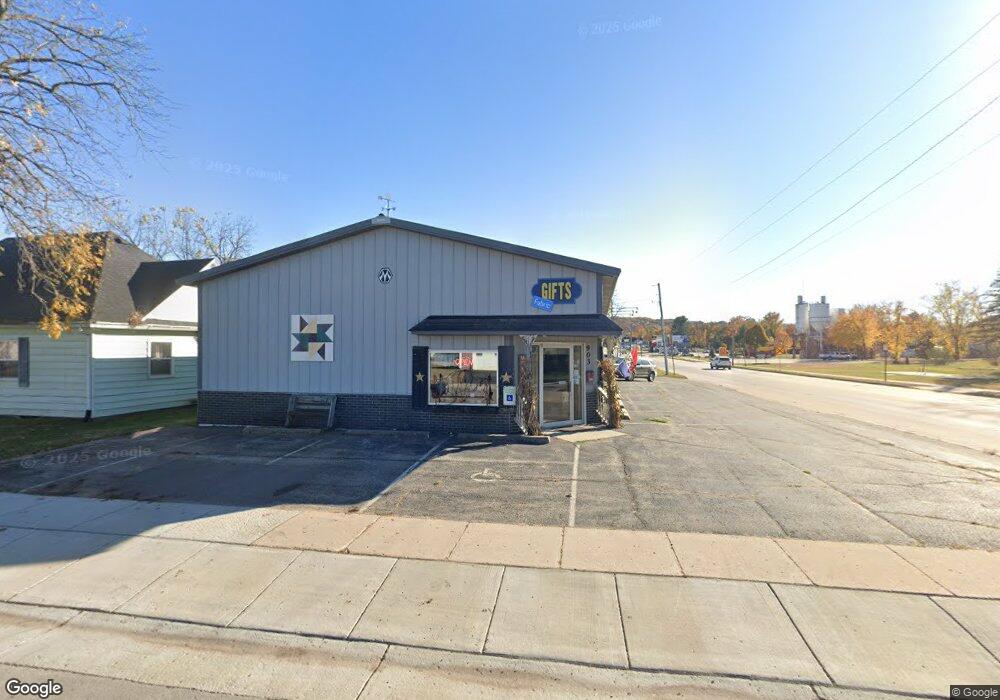
903 Elm St Boscobel, WI 53805
Estimated Value: $226,027
--
Bed
--
Bath
4,400
Sq Ft
$51/Sq Ft
Est. Value
About This Home
This home is located at 903 Elm St, Boscobel, WI 53805 and is currently estimated at $226,027, approximately $51 per square foot. 903 Elm St is a home located in Grant County with nearby schools including Boscobel Elementary School, Boscobel Junior High School, and Boscobel High School.
Ownership History
Date
Name
Owned For
Owner Type
Purchase Details
Closed on
Nov 20, 2017
Sold by
Wilderness Ridge Investments Llc
Bought by
Paisley Stay Llc
Current Estimated Value
Home Financials for this Owner
Home Financials are based on the most recent Mortgage that was taken out on this home.
Original Mortgage
$137,907
Outstanding Balance
$115,560
Interest Rate
3.85%
Mortgage Type
New Conventional
Estimated Equity
$110,468
Purchase Details
Closed on
Dec 5, 2011
Sold by
J R Gibbs Inc
Bought by
Wilderness Ridge Investments Llc
Home Financials for this Owner
Home Financials are based on the most recent Mortgage that was taken out on this home.
Original Mortgage
$116,000
Interest Rate
3.99%
Mortgage Type
Purchase Money Mortgage
Purchase Details
Closed on
Dec 29, 2008
Sold by
Gibbs Judith R
Bought by
J R Gibbs Inc
Create a Home Valuation Report for This Property
The Home Valuation Report is an in-depth analysis detailing your home's value as well as a comparison with similar homes in the area
Home Values in the Area
Average Home Value in this Area
Purchase History
| Date | Buyer | Sale Price | Title Company |
|---|---|---|---|
| Paisley Stay Llc | -- | None Available | |
| Wilderness Ridge Investments Llc | $128,000 | -- | |
| J R Gibbs Inc | -- | -- |
Source: Public Records
Mortgage History
| Date | Status | Borrower | Loan Amount |
|---|---|---|---|
| Open | Paisley Stay Llc | $137,907 | |
| Previous Owner | Wilderness Ridge Investments Llc | $116,000 |
Source: Public Records
Tax History Compared to Growth
Tax History
| Year | Tax Paid | Tax Assessment Tax Assessment Total Assessment is a certain percentage of the fair market value that is determined by local assessors to be the total taxable value of land and additions on the property. | Land | Improvement |
|---|---|---|---|---|
| 2024 | $4,134 | $218,400 | $6,600 | $211,800 |
| 2023 | $3,938 | $174,700 | $6,600 | $168,100 |
| 2022 | $3,681 | $132,900 | $6,600 | $126,300 |
| 2021 | $3,335 | $132,900 | $6,600 | $126,300 |
| 2020 | $3,302 | $132,900 | $6,600 | $126,300 |
| 2019 | $3,253 | $132,900 | $660 | $12,630 |
| 2018 | $3,124 | $132,900 | $6,600 | $126,300 |
| 2017 | $2,421 | $104,400 | $6,600 | $97,800 |
| 2016 | $2,397 | $104,400 | $6,600 | $97,800 |
| 2015 | $2,029 | $104,400 | $6,600 | $97,800 |
| 2014 | $2,183 | $104,400 | $6,600 | $97,800 |
| 2013 | -- | $104,400 | $6,600 | $97,800 |
Source: Public Records
Map
Nearby Homes
- 208 W Oak St
- 400 Hill Dr
- 204 W Kansas St
- 304 Pearl St
- 320 Wisconsin Ave
- 301 Superior St
- 103 Brindley St
- 209 Adams St
- 307 Fremont St
- 1107 Yahn Ave
- 405 Airport Rd
- 901 E Bluff St
- 127 Pine Circle Dr
- 133 Pine Circle Dr
- 107 Windsong Ct
- 118 Doc Mac Dr
- 116 Doc Mac Dr
- 117 Doc Mac Dr
- 113 Windsong Ct
- 115 Windsong Ct