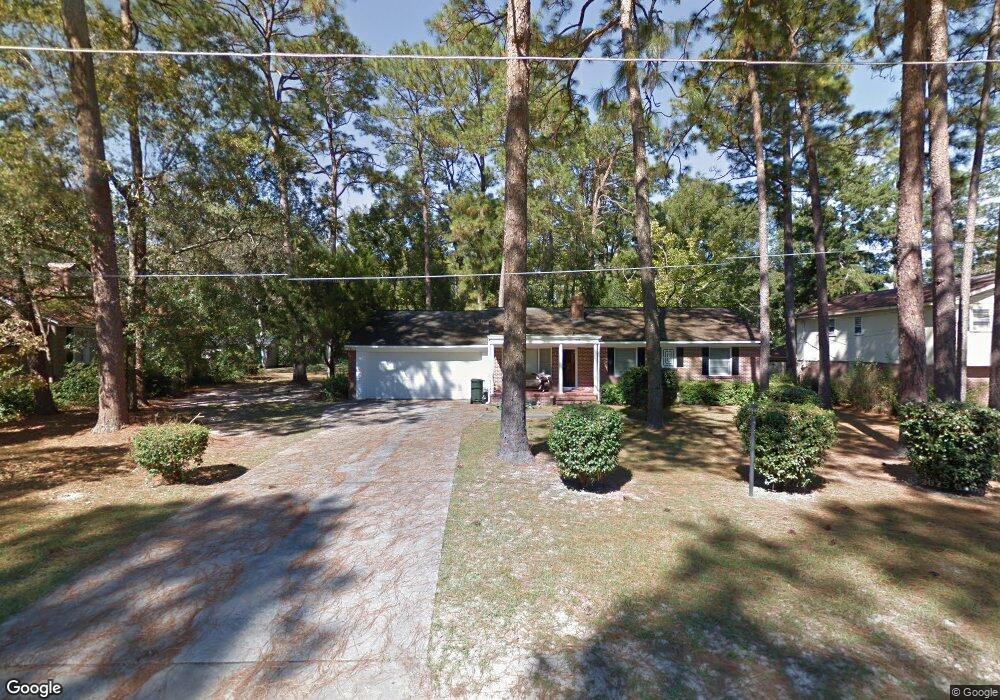
903 Euclid Ave Waycross, GA 31501
Estimated Value: $164,000 - $183,000
3
Beds
2
Baths
1,482
Sq Ft
$119/Sq Ft
Est. Value
About This Home
This home is located at 903 Euclid Ave, Waycross, GA 31501 and is currently estimated at $175,682, approximately $118 per square foot. 903 Euclid Ave is a home located in Ware County with nearby schools including Williams Heights Elementary School, Waycross Middle School, and Ware County High School.
Ownership History
Date
Name
Owned For
Owner Type
Purchase Details
Closed on
May 6, 2021
Sold by
Gispert Sandra
Bought by
White Micheal
Current Estimated Value
Home Financials for this Owner
Home Financials are based on the most recent Mortgage that was taken out on this home.
Original Mortgage
$133,000
Outstanding Balance
$120,531
Interest Rate
3.1%
Mortgage Type
VA
Estimated Equity
$55,151
Purchase Details
Closed on
Aug 30, 2019
Sold by
Sweat Sandy
Bought by
Gispert Sandra
Home Financials for this Owner
Home Financials are based on the most recent Mortgage that was taken out on this home.
Original Mortgage
$64,800
Interest Rate
3.7%
Mortgage Type
New Conventional
Purchase Details
Closed on
Feb 7, 2019
Sold by
Sweat Skylar Lee
Bought by
Sweat Sandy
Purchase Details
Closed on
Sep 30, 2014
Sold by
Sweat Sandy
Bought by
Sweat Sandy and Sweat Skylar Lee
Purchase Details
Closed on
Apr 4, 1997
Sold by
Raynor George L Est
Bought by
Yawn Earline
Create a Home Valuation Report for This Property
The Home Valuation Report is an in-depth analysis detailing your home's value as well as a comparison with similar homes in the area
Home Values in the Area
Average Home Value in this Area
Purchase History
| Date | Buyer | Sale Price | Title Company |
|---|---|---|---|
| White Micheal | $133,000 | -- | |
| Gispert Sandra | $81,000 | -- | |
| Sweat Sandy | -- | -- | |
| Sweat Sandy | -- | -- | |
| Sweat Sandy | -- | -- | |
| Yawn Earline | $37,500 | -- |
Source: Public Records
Mortgage History
| Date | Status | Borrower | Loan Amount |
|---|---|---|---|
| Open | White Micheal | $133,000 | |
| Previous Owner | Gispert Sandra | $64,800 |
Source: Public Records
Tax History Compared to Growth
Tax History
| Year | Tax Paid | Tax Assessment Tax Assessment Total Assessment is a certain percentage of the fair market value that is determined by local assessors to be the total taxable value of land and additions on the property. | Land | Improvement |
|---|---|---|---|---|
| 2024 | -- | $50,482 | $6,880 | $43,602 |
| 2023 | $0 | $54,260 | $6,452 | $47,808 |
| 2022 | $2,162 | $54,260 | $6,452 | $47,808 |
| 2021 | $1,775 | $41,038 | $6,452 | $34,586 |
| 2020 | $1,412 | $39,308 | $6,452 | $32,856 |
| 2019 | $1,623 | $36,714 | $6,452 | $30,262 |
| 2018 | $1,590 | $35,634 | $6,452 | $29,182 |
| 2017 | $1,554 | $35,634 | $6,452 | $29,182 |
| 2016 | $1,554 | $35,634 | $6,452 | $29,182 |
| 2015 | $1,565 | $35,633 | $6,452 | $29,182 |
| 2014 | $1,327 | $35,634 | $6,452 | $29,182 |
| 2013 | -- | $39,284 | $6,452 | $32,832 |
Source: Public Records
Map
Nearby Homes
- 907 Euclid Ave
- 1001 Coral Rd
- 1500 Saint Marys Dr
- 0 Saint Marys Dr Unit (TRACT 2 0.25 ACRES)
- 1009 Euclid Ave
- 707 Euclid Ave
- 1100 Euclid Ave
- 1205 Dean Dr
- 706 Cherokee Cir
- 1002 Baltimore Ave
- 903 Atlantic Ave
- 1002 Cherokee Cir
- 1011 Cherokee Cir
- 1701 Satilla Blvd
- 713 Magnolia Dr
- 1100 Atlantic Ave
- 00 Seminole Trail
- 1101 Cherokee Dr
- Lot 3 City Blvd
- 511 Richmond Ave