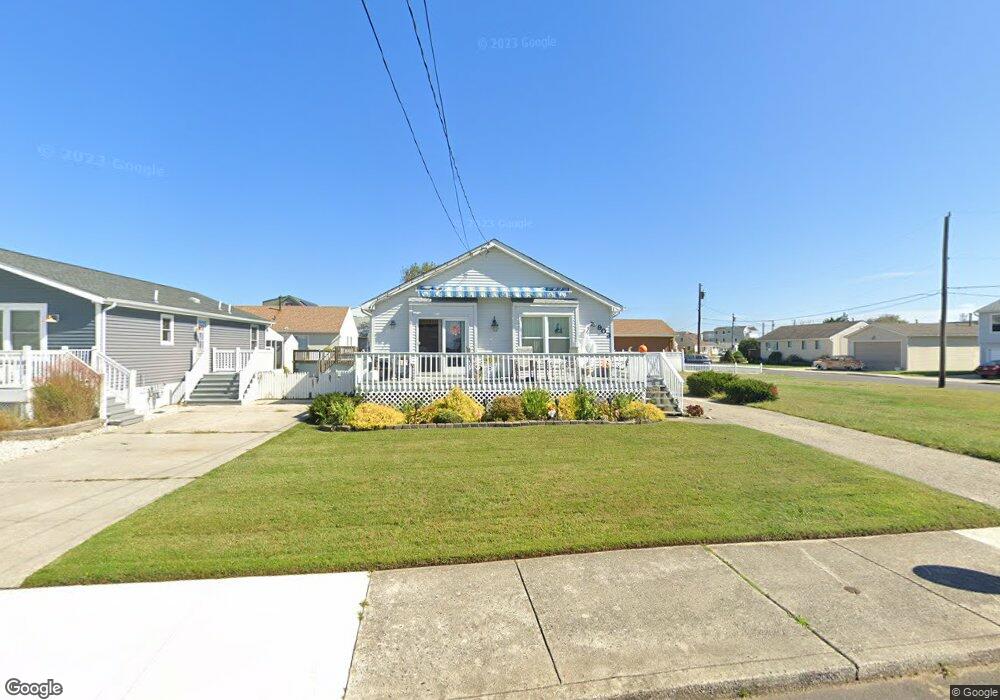
903 Fownes Ave Brigantine, NJ 08203
Estimated Value: $465,000 - $603,000
3
Beds
2
Baths
1,288
Sq Ft
$433/Sq Ft
Est. Value
About This Home
This home is located at 903 Fownes Ave, Brigantine, NJ 08203 and is currently estimated at $557,830, approximately $433 per square foot. 903 Fownes Ave is a home located in Atlantic County with nearby schools including Brigantine Elementary School and Brigantine Community School.
Ownership History
Date
Name
Owned For
Owner Type
Purchase Details
Closed on
Mar 3, 2022
Sold by
Robert Laurenzi
Bought by
Corapi Robert A and Corapi Robert A
Current Estimated Value
Home Financials for this Owner
Home Financials are based on the most recent Mortgage that was taken out on this home.
Original Mortgage
$250,750
Interest Rate
3.76%
Mortgage Type
New Conventional
Purchase Details
Closed on
Jun 30, 2016
Sold by
Laurenzi Rita and Corapi Ellen
Bought by
Laurenzi Rita and Laurenzi Robert
Purchase Details
Closed on
May 17, 2010
Sold by
Laurenzi Rita
Bought by
Laurenzi Rita and Corapi Ellen
Purchase Details
Closed on
Jun 3, 2002
Sold by
Stella Albert M and Stella Catherine M
Bought by
Laurenzi Armand Frank and Laurenzi Rita
Purchase Details
Closed on
May 21, 1991
Sold by
Steilla Albert M and Steilla Michael
Bought by
Stella Albert M
Create a Home Valuation Report for This Property
The Home Valuation Report is an in-depth analysis detailing your home's value as well as a comparison with similar homes in the area
Home Values in the Area
Average Home Value in this Area
Purchase History
| Date | Buyer | Sale Price | Title Company |
|---|---|---|---|
| Corapi Robert A | $313,500 | Surety Title | |
| Laurenzi Rita | -- | -- | |
| Laurenzi Rita | -- | Commonwealth Land Title Insu | |
| Laurenzi Armand Frank | $189,900 | Commonwealth Land Title Ins | |
| Stella Albert M | -- | -- |
Source: Public Records
Mortgage History
| Date | Status | Borrower | Loan Amount |
|---|---|---|---|
| Previous Owner | Corapi Robert A | $250,750 |
Source: Public Records
Tax History Compared to Growth
Tax History
| Year | Tax Paid | Tax Assessment Tax Assessment Total Assessment is a certain percentage of the fair market value that is determined by local assessors to be the total taxable value of land and additions on the property. | Land | Improvement |
|---|---|---|---|---|
| 2025 | $4,888 | $260,000 | $161,900 | $98,100 |
| 2024 | $4,888 | $260,000 | $161,900 | $98,100 |
| 2023 | $4,516 | $260,000 | $161,900 | $98,100 |
| 2022 | $4,516 | $260,000 | $161,900 | $98,100 |
| 2021 | $4,436 | $260,000 | $161,900 | $98,100 |
| 2020 | $3,889 | $260,000 | $161,900 | $98,100 |
| 2019 | $3,928 | $260,000 | $161,900 | $98,100 |
| 2018 | $4,266 | $260,000 | $161,900 | $98,100 |
| 2017 | $4,089 | $260,000 | $161,900 | $98,100 |
| 2016 | $4,086 | $260,000 | $161,900 | $98,100 |
| 2015 | $4,110 | $260,000 | $161,900 | $98,100 |
| 2014 | $4,117 | $270,500 | $161,900 | $108,600 |
Source: Public Records
Map
Nearby Homes
- 42 Kirkwood Cir
- 217 Hagen Rd
- 1223 E Shore Dr
- 1225 E Shore Dr
- 25 Travers Place
- 1000 Sheridan Blvd
- 20 Heald Rd
- 1411 E Shore Dr
- 1511 E Shore Dr
- 107 8th St N
- 1100 Sheridan Blvd
- 113 Quay Blvd
- 1203 Beach Ave E Unit 8
- 1203 E Beach Ave Unit 8
- 1200 Beach Ave E
- 111 Hamilton Place
- 208 14th St N Unit A
- 1202 Sheridan Blvd Unit 203
- 2 Franklin Place
- 1040 N Shore Dr
- 905 Fownes Ave
- 901 Fownes Ave
- 3 Dunlap Place
- 907 Fownes Ave
- 4 Spalding Place
- 1 Dunlap Place
- 805 Fownes Ave
- 2 Spalding Place
- 902 Fownes Ave
- 900 Fownes Ave
- 810 Fownes Ave
- 906 Fownes Ave
- 806 E Shore Dr
- 803 Fownes Ave Unit 24
- 1001 Fownes Ave
- 900 E Shore Dr
- 902 E Shore Dr
- 808 Fownes Ave
- 904 E Shore Dr
- 908 Fownes Ave