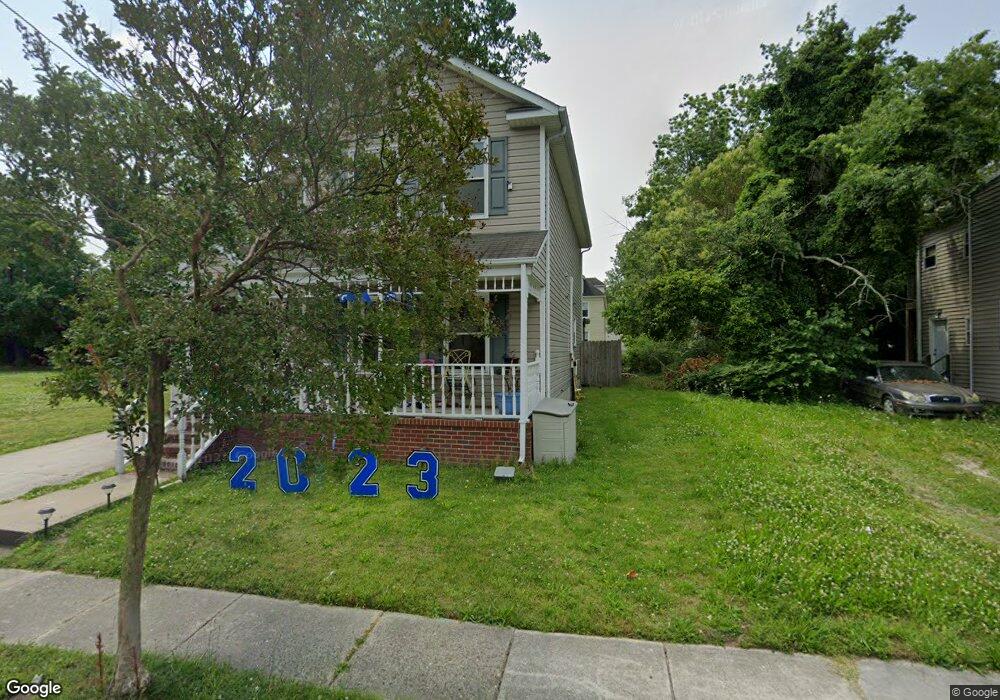
903 Fremont St Norfolk, VA 23504
Olde Huntersville NeighborhoodEstimated Value: $237,000 - $255,550
3
Beds
3
Baths
1,468
Sq Ft
$167/Sq Ft
Est. Value
About This Home
This home is located at 903 Fremont St, Norfolk, VA 23504 and is currently estimated at $245,888, approximately $167 per square foot. 903 Fremont St is a home located in Norfolk City with nearby schools including Jacox Elementary School, Blair Middle School, and Granby High School.
Ownership History
Date
Name
Owned For
Owner Type
Purchase Details
Closed on
Jan 11, 2007
Sold by
Brehon Gregory C and Brehon Justina P
Bought by
Soto Manuel A
Current Estimated Value
Home Financials for this Owner
Home Financials are based on the most recent Mortgage that was taken out on this home.
Original Mortgage
$173,655
Outstanding Balance
$103,371
Interest Rate
6.14%
Mortgage Type
New Conventional
Estimated Equity
$142,517
Create a Home Valuation Report for This Property
The Home Valuation Report is an in-depth analysis detailing your home's value as well as a comparison with similar homes in the area
Home Values in the Area
Average Home Value in this Area
Purchase History
| Date | Buyer | Sale Price | Title Company |
|---|---|---|---|
| Soto Manuel A | $170,000 | -- |
Source: Public Records
Mortgage History
| Date | Status | Borrower | Loan Amount |
|---|---|---|---|
| Open | Soto Manuel A | $173,655 |
Source: Public Records
Tax History Compared to Growth
Tax History
| Year | Tax Paid | Tax Assessment Tax Assessment Total Assessment is a certain percentage of the fair market value that is determined by local assessors to be the total taxable value of land and additions on the property. | Land | Improvement |
|---|---|---|---|---|
| 2025 | $2,864 | $229,100 | $43,500 | $185,600 |
| 2024 | $2,676 | $217,600 | $43,500 | $174,100 |
| 2023 | $2,608 | $208,600 | $43,500 | $165,100 |
| 2022 | $2,273 | $181,800 | $30,000 | $151,800 |
| 2021 | $2,043 | $163,400 | $26,800 | $136,600 |
| 2020 | $2,043 | $163,400 | $26,800 | $136,600 |
| 2019 | $1,836 | $146,900 | $26,800 | $120,100 |
| 2018 | $1,716 | $137,300 | $26,800 | $110,500 |
| 2017 | $1,577 | $137,100 | $26,800 | $110,300 |
| 2016 | $1,548 | $132,300 | $26,800 | $105,500 |
| 2015 | $1,509 | $132,300 | $26,800 | $105,500 |
| 2014 | $1,509 | $132,300 | $26,800 | $105,500 |
Source: Public Records
Map
Nearby Homes
- 901 Fremont St
- 907 Fremont St
- 895 Fremont St
- 913 Fremont St
- 891 Fremont St
- 919 Fremont St
- 894 Lexington St
- 900 Lexington St
- 887 Fremont St
- 902 Lexington St
- 929 Fremont St
- 904 Lexington St
- 898 Fremont St
- 882 Fremont St
- 885 Fremont St
- 888 Fremont St
- 884 Fremont St
- 904 Fremont St
- 933 Fremont St
- 877 Fremont St