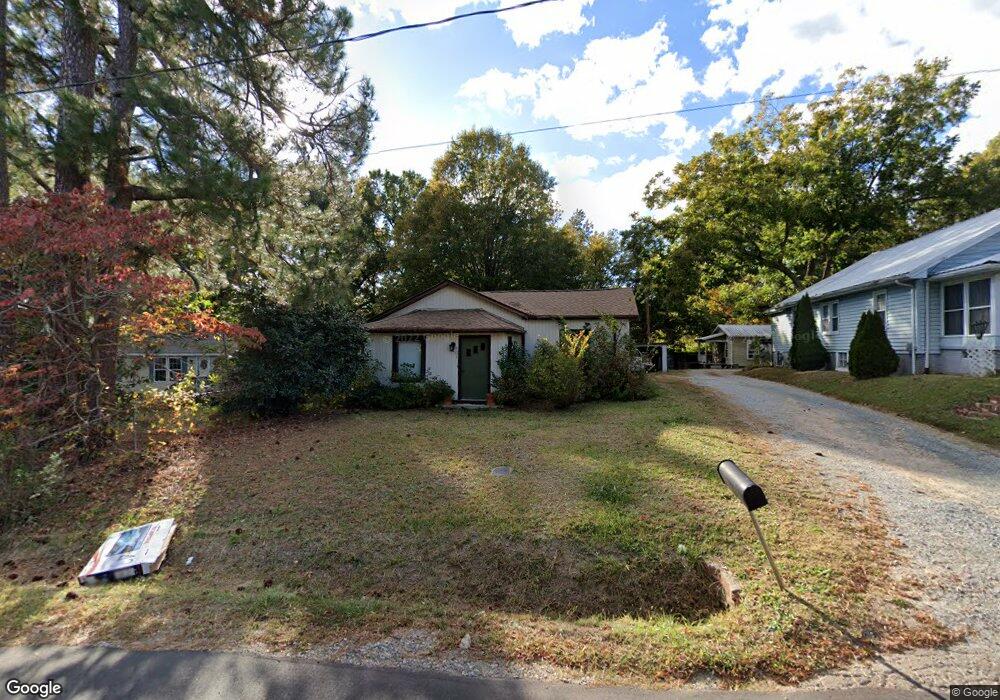
903 Grace Ave Kannapolis, NC 28083
Estimated Value: $227,000 - $258,866
3
Beds
2
Baths
1,241
Sq Ft
$197/Sq Ft
Est. Value
About This Home
This home is located at 903 Grace Ave, Kannapolis, NC 28083 and is currently estimated at $244,967, approximately $197 per square foot. 903 Grace Ave is a home located in Rowan County with nearby schools including Jackson Park Elementary School, Kannapolis Middle, and A.L. Brown High School.
Ownership History
Date
Name
Owned For
Owner Type
Purchase Details
Closed on
Jul 18, 2018
Sold by
Secoolish James and Secoolish Elizabeth
Bought by
Secoolish James
Current Estimated Value
Purchase Details
Closed on
Jan 18, 2017
Sold by
Schubert Glenn and Schubert Pamela K
Bought by
Secoolish James and Secoolish Elizabeth
Home Financials for this Owner
Home Financials are based on the most recent Mortgage that was taken out on this home.
Original Mortgage
$93,033
Outstanding Balance
$79,504
Interest Rate
5.5%
Mortgage Type
FHA
Estimated Equity
$165,463
Purchase Details
Closed on
Jul 6, 2016
Sold by
Young Evelyn C
Bought by
Schubert Glenn
Home Financials for this Owner
Home Financials are based on the most recent Mortgage that was taken out on this home.
Original Mortgage
$35,000
Interest Rate
3.64%
Mortgage Type
Purchase Money Mortgage
Create a Home Valuation Report for This Property
The Home Valuation Report is an in-depth analysis detailing your home's value as well as a comparison with similar homes in the area
Home Values in the Area
Average Home Value in this Area
Purchase History
| Date | Buyer | Sale Price | Title Company |
|---|---|---|---|
| Secoolish James | -- | None Available | |
| Secoolish James | $95,000 | Investors Title Insurance Co | |
| Schubert Glenn | $35,000 | None Available |
Source: Public Records
Mortgage History
| Date | Status | Borrower | Loan Amount |
|---|---|---|---|
| Open | Secoolish James | $93,033 | |
| Closed | Secoolish James | $4,651 | |
| Previous Owner | Schubert Glenn | $35,000 |
Source: Public Records
Tax History Compared to Growth
Tax History
| Year | Tax Paid | Tax Assessment Tax Assessment Total Assessment is a certain percentage of the fair market value that is determined by local assessors to be the total taxable value of land and additions on the property. | Land | Improvement |
|---|---|---|---|---|
| 2025 | $2,343 | $193,606 | $35,000 | $158,606 |
| 2024 | $2,343 | $193,606 | $35,000 | $158,606 |
| 2023 | $2,343 | $193,606 | $35,000 | $158,606 |
| 2022 | $1,614 | $125,379 | $28,000 | $97,379 |
| 2021 | $1,614 | $125,379 | $28,000 | $97,379 |
| 2020 | $1,614 | $125,379 | $28,000 | $97,379 |
| 2019 | $1,614 | $125,379 | $28,000 | $97,379 |
| 2018 | $1,208 | $94,892 | $13,500 | $81,392 |
| 2017 | $1,208 | $94,892 | $13,500 | $81,392 |
| 2016 | $908 | $71,319 | $13,500 | $57,819 |
| 2015 | $922 | $71,319 | $13,500 | $57,819 |
| 2014 | $783 | $62,650 | $11,880 | $50,770 |
Source: Public Records
Map
Nearby Homes
- 904 Marie Ave
- 712 Grace Ave
- 807 Carolyn Ave
- 1202 Woodlawn St
- 916 Taylor St
- 904 Venus St
- 1206 Poplar Glen Dr
- 604 Pearl Ave
- 776 Washington Ln
- 1102 Lane St
- 1001 N Cannon Blvd
- 1905 Clay St
- 311 Jean Ave
- 606 Jackson St
- 406 Ruth Ave
- 2008 Woodlawn St
- 0 Goble Ave
- 601 E 13th St
- 2105 Woodlawn St
- 520 Wright Ave