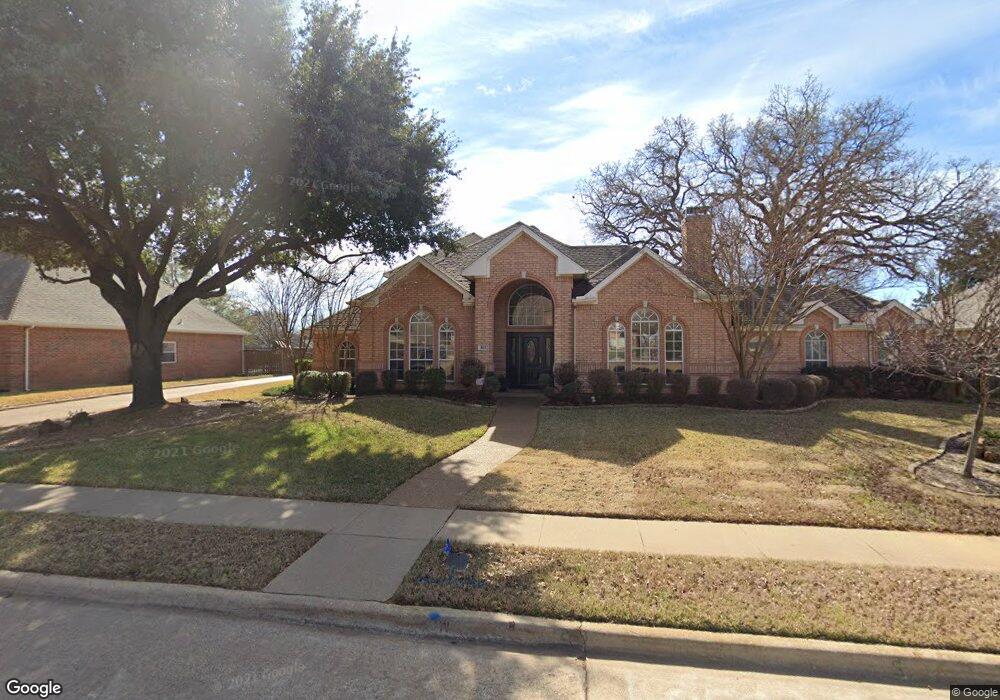
903 Hardage Ln Colleyville, TX 76034
Estimated Value: $798,000 - $881,000
4
Beds
3
Baths
3,136
Sq Ft
$269/Sq Ft
Est. Value
About This Home
This home is located at 903 Hardage Ln, Colleyville, TX 76034 and is currently estimated at $843,250, approximately $268 per square foot. 903 Hardage Ln is a home located in Tarrant County with nearby schools including Colleyville Elementary School, Colleyville Middle School, and Grapevine High School.
Ownership History
Date
Name
Owned For
Owner Type
Purchase Details
Closed on
Apr 29, 1999
Sold by
Monacelli Eugene C and Monacelli Cecilia A
Bought by
Hopson John Daniel and Hopson Vel Jean
Current Estimated Value
Home Financials for this Owner
Home Financials are based on the most recent Mortgage that was taken out on this home.
Original Mortgage
$236,000
Outstanding Balance
$60,726
Interest Rate
6.99%
Estimated Equity
$782,524
Purchase Details
Closed on
Aug 8, 1995
Sold by
Shrode Jerry D and Shrode Cindy
Bought by
Monacelli Eugene C and Monacelli Cecilia A
Home Financials for this Owner
Home Financials are based on the most recent Mortgage that was taken out on this home.
Original Mortgage
$202,800
Interest Rate
7.54%
Create a Home Valuation Report for This Property
The Home Valuation Report is an in-depth analysis detailing your home's value as well as a comparison with similar homes in the area
Home Values in the Area
Average Home Value in this Area
Purchase History
| Date | Buyer | Sale Price | Title Company |
|---|---|---|---|
| Hopson John Daniel | -- | -- | |
| Monacelli Eugene C | -- | Fidelity National Title Agen |
Source: Public Records
Mortgage History
| Date | Status | Borrower | Loan Amount |
|---|---|---|---|
| Open | Hopson John Daniel | $236,000 | |
| Previous Owner | Monacelli Eugene C | $202,800 | |
| Closed | Hopson John Daniel | $44,250 |
Source: Public Records
Tax History Compared to Growth
Tax History
| Year | Tax Paid | Tax Assessment Tax Assessment Total Assessment is a certain percentage of the fair market value that is determined by local assessors to be the total taxable value of land and additions on the property. | Land | Improvement |
|---|---|---|---|---|
| 2025 | $2,479 | $732,524 | $230,150 | $502,374 |
| 2024 | $2,479 | $732,524 | $230,150 | $502,374 |
| 2023 | $10,246 | $823,833 | $230,150 | $593,683 |
| 2022 | $10,905 | $608,711 | $230,150 | $378,561 |
| 2021 | $11,023 | $501,963 | $138,090 | $363,873 |
| 2020 | $11,702 | $526,637 | $138,090 | $388,547 |
| 2019 | $11,343 | $537,871 | $138,090 | $399,781 |
| 2018 | $2,651 | $446,002 | $138,090 | $307,912 |
| 2017 | $10,804 | $457,316 | $138,090 | $319,226 |
| 2016 | $10,412 | $440,747 | $135,090 | $305,657 |
| 2015 | $8,806 | $407,800 | $60,000 | $347,800 |
| 2014 | $8,806 | $407,800 | $60,000 | $347,800 |
Source: Public Records
Map
Nearby Homes
- 6200 Pleasant Run Rd
- 1315 Hardage Ln
- 5913 Preston Way
- 5902 Preston Way
- 1509 Tinker Rd
- 6401 Westcoat Dr
- 6900 Sir Spencer Ct
- 7000 Shalimar Ct
- Lot 4 Amelia Ct
- 1813 Grosvenor Green
- 7005 Whippoorwill Ct
- TBD - Lot 3 John Mccain Rd
- TBD - Lot 1 John Mccain Rd
- 217 Oak Valley Dr
- 7012 Shepherds Glen
- 5609 Oak Top Dr
- 5508 Coventry Ct
- 55 Main St Unit 300
- 203 Oak Valley Dr
- 1521 Four Seasons Dr
- 905 Hardage Ln
- 902 Hardage Ln
- 907 Hardage Ln
- 900 Hardage Ln
- 904 Hardage Ln
- 6105 Pleasant Run Rd
- 906 Hardage Ln
- 6114 Waller Ln
- 6200 Pleasant Run Rd
- 1001 Hardage Ln
- 6213 Pleasant Run Rd
- 1000 Hardage Ln
- 6112 Waller Ln
- 6204 Pleasant Run Rd
- 6114 Pleasant Run Rd
- 6108 Waller Ln
- 1002 Hardage Ln
- 6212 Pleasant Run Rd
- 6215 Pleasant Run Rd
- 6117 Waller Ln