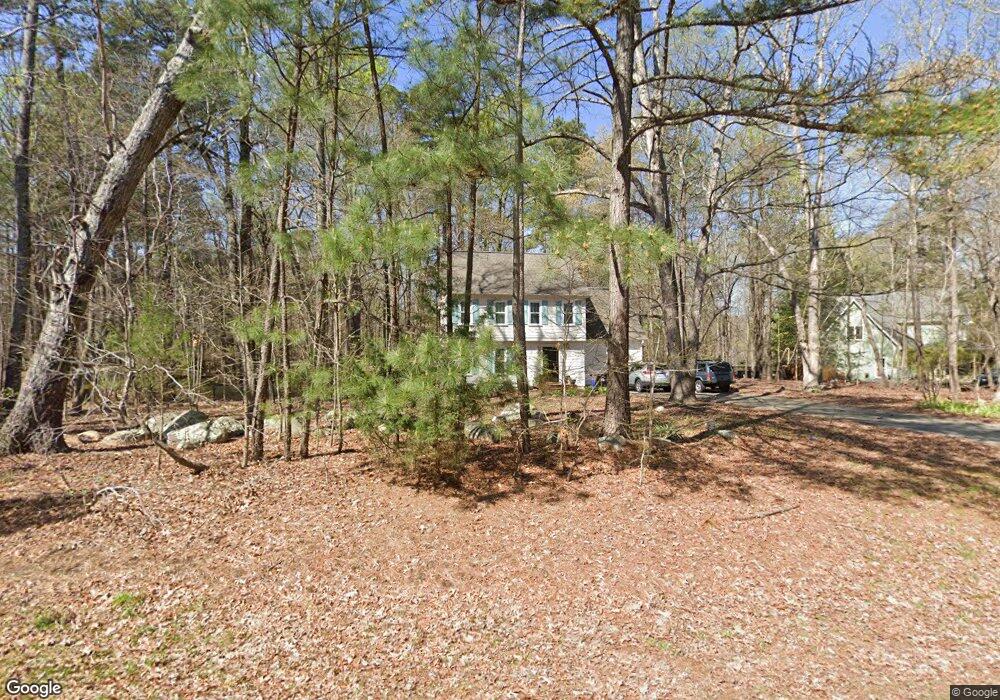
903 Highland Trail Chapel Hill, NC 27516
Estimated Value: $437,000 - $486,000
3
Beds
3
Baths
1,632
Sq Ft
$283/Sq Ft
Est. Value
About This Home
This home is located at 903 Highland Trail, Chapel Hill, NC 27516 and is currently estimated at $462,443, approximately $283 per square foot. 903 Highland Trail is a home located in Chatham County with nearby schools including Margaret B. Pollard Middle School, Northwood High, and Holy Youth Christian Academy.
Ownership History
Date
Name
Owned For
Owner Type
Purchase Details
Closed on
Dec 23, 2020
Sold by
Hubbard Joseph and Hubbard Lauren
Bought by
Bunce Christopher and Bunce Stephanie L
Current Estimated Value
Home Financials for this Owner
Home Financials are based on the most recent Mortgage that was taken out on this home.
Original Mortgage
$169,000
Outstanding Balance
$150,386
Interest Rate
2.8%
Mortgage Type
New Conventional
Estimated Equity
$312,057
Purchase Details
Closed on
Aug 26, 2015
Sold by
Hunter Jack R and Hunter Kathleen G J
Bought by
Hubbard Joseph and Hubbard Lauren
Home Financials for this Owner
Home Financials are based on the most recent Mortgage that was taken out on this home.
Original Mortgage
$227,900
Interest Rate
3.94%
Mortgage Type
New Conventional
Purchase Details
Closed on
Oct 27, 2008
Sold by
Hunter Jack R and Hunter Kathleen G J
Bought by
Hunter Jack R and Hunter Kathleen G J
Home Financials for this Owner
Home Financials are based on the most recent Mortgage that was taken out on this home.
Original Mortgage
$170,000
Interest Rate
6.11%
Mortgage Type
Purchase Money Mortgage
Create a Home Valuation Report for This Property
The Home Valuation Report is an in-depth analysis detailing your home's value as well as a comparison with similar homes in the area
Home Values in the Area
Average Home Value in this Area
Purchase History
| Date | Buyer | Sale Price | Title Company |
|---|---|---|---|
| Bunce Christopher | $319,000 | None Available | |
| Bunce Christopher | $319,000 | Hunter David | |
| Hubbard Joseph | $240,000 | Attorney | |
| Hunter Jack R | -- | None Available |
Source: Public Records
Mortgage History
| Date | Status | Borrower | Loan Amount |
|---|---|---|---|
| Open | Bunce Christopher | $169,000 | |
| Closed | Bunce Christopher | $169,000 | |
| Previous Owner | Hubbard Joseph | $227,900 | |
| Previous Owner | Hunter Jack R | $170,000 |
Source: Public Records
Tax History Compared to Growth
Tax History
| Year | Tax Paid | Tax Assessment Tax Assessment Total Assessment is a certain percentage of the fair market value that is determined by local assessors to be the total taxable value of land and additions on the property. | Land | Improvement |
|---|---|---|---|---|
| 2025 | $3,025 | $408,529 | $91,105 | $317,424 |
| 2024 | $3,025 | $255,728 | $62,335 | $193,393 |
| 2023 | $2,318 | $255,728 | $62,335 | $193,393 |
| 2022 | $2,127 | $255,728 | $62,335 | $193,393 |
| 2021 | $2,102 | $255,728 | $62,335 | $193,393 |
| 2020 | $1,981 | $238,606 | $50,347 | $188,259 |
| 2019 | $1,981 | $238,606 | $50,347 | $188,259 |
| 2018 | $1,869 | $238,606 | $50,347 | $188,259 |
| 2017 | $1,869 | $238,606 | $50,347 | $188,259 |
| 2016 | $1,808 | $228,365 | $47,950 | $180,415 |
| 2015 | $1,780 | $228,365 | $47,950 | $180,415 |
| 2014 | $1,746 | $228,365 | $47,950 | $180,415 |
| 2013 | -- | $228,365 | $47,950 | $180,415 |
Source: Public Records
Map
Nearby Homes
- 82 Margaret Daniel Ln
- 103 Stonehill Rd
- 3537 Lodge Trail
- 594 Cedar Lake Rd Unit A & B
- 708 October Woods Rd
- 51 Araya Ln
- 348 Cedar Lake Rd Unit A & B
- 403 Brandywine Rd
- 2306 Damascus Church Rd
- 23 Bonterra Way
- 1705 Smith Level Rd Unit A
- 34 Chestnut Way
- 110 Wolfs Trail
- 17 Monteith Dr
- 39 Monteith Dr
- Nora II Plan at Chapel Oaks
- Stoneridge Plan at Chapel Oaks
- Hampshire Plan at Chapel Oaks
- Kendrick Plan at Chapel Oaks
- Rosella Plan at Chapel Oaks
- 905 Highland Trail
- 906 Highland Trail
- 907 Highland Trail
- 904 Highland Trail
- 908 Highland Trail
- 910 Highland Trail
- 902 Highland Trail
- 603 Stonehill Rd
- 1001 Highland Trail
- 900 Highland Trail
- 101 Trailwood Ct
- 1103 Highland Trail
- 1003 Highland Trail
- 1105 Highland Trail
- 102 Trailwood Ct
- 1002 Highland Trail
- 1101 Highland Trail
- 810 Highland Trail
- 807 Highland Trail
- 604 Stonehill Rd