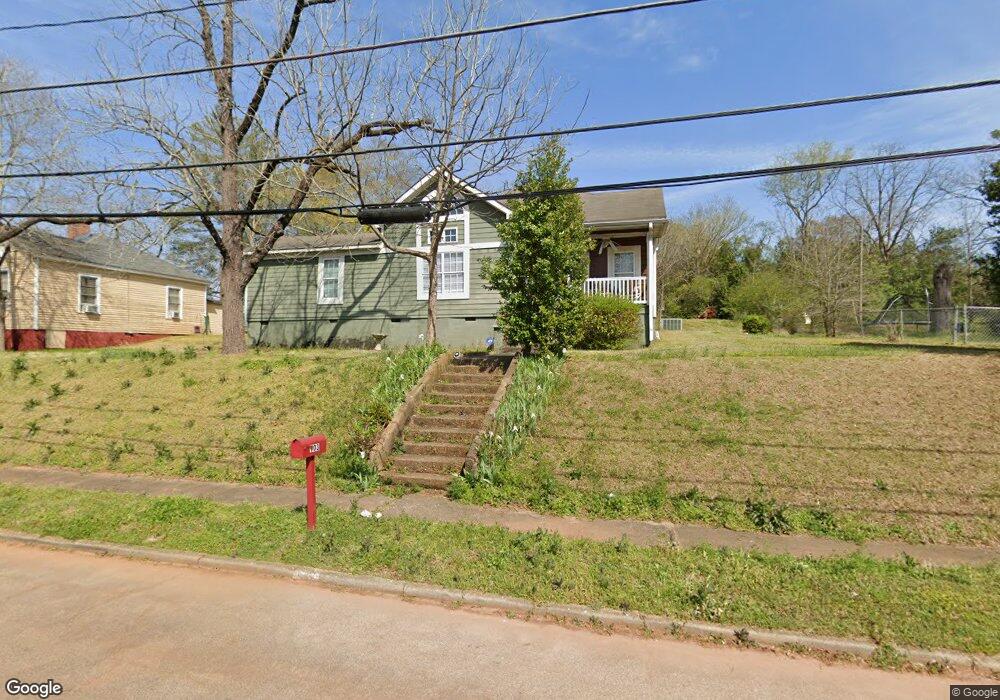
903 Juniper St Lagrange, GA 30240
Estimated Value: $165,000 - $210,918
4
Beds
2
Baths
1,814
Sq Ft
$103/Sq Ft
Est. Value
About This Home
This home is located at 903 Juniper St, Lagrange, GA 30240 and is currently estimated at $187,480, approximately $103 per square foot. 903 Juniper St is a home located in Troup County with nearby schools including Berta Weathersbee Elementary School, Whitesville Road Elementary School, and Rosemont Elementary School.
Ownership History
Date
Name
Owned For
Owner Type
Purchase Details
Closed on
Jul 28, 2005
Sold by
Dash For Lagrqange Inc
Bought by
Greenslate Crystal A
Current Estimated Value
Home Financials for this Owner
Home Financials are based on the most recent Mortgage that was taken out on this home.
Original Mortgage
$117,740
Outstanding Balance
$59,964
Interest Rate
5.48%
Mortgage Type
FHA
Estimated Equity
$127,516
Purchase Details
Closed on
Feb 24, 2005
Sold by
Anderson Investment Grp Ll
Bought by
Dash For Lagrqange Inc
Purchase Details
Closed on
Nov 6, 2002
Sold by
Newton Anderson and Newton
Bought by
Anderson Investment Grp Llc
Purchase Details
Closed on
Jun 18, 2002
Sold by
Dorothy Mary and Dorothy Crawford
Bought by
Newton Anderson and Newton
Purchase Details
Closed on
Jan 1, 1950
Sold by
Callaway Fdn
Bought by
Dorothy Mary and Dorothy Crawford
Create a Home Valuation Report for This Property
The Home Valuation Report is an in-depth analysis detailing your home's value as well as a comparison with similar homes in the area
Purchase History
| Date | Buyer | Sale Price | Title Company |
|---|---|---|---|
| Greenslate Crystal A | $136,800 | -- | |
| Dash For Lagrqange Inc | $14,000 | -- | |
| Anderson Investment Grp Llc | -- | -- | |
| Newton Anderson | $24,000 | -- | |
| Dorothy Mary | -- | -- |
Source: Public Records
Mortgage History
| Date | Status | Borrower | Loan Amount |
|---|---|---|---|
| Open | Greenslate Crystal A | $117,740 | |
| Closed | Greenslate Crystal A | $10,000 |
Source: Public Records
Tax History
| Year | Tax Paid | Tax Assessment Tax Assessment Total Assessment is a certain percentage of the fair market value that is determined by local assessors to be the total taxable value of land and additions on the property. | Land | Improvement |
|---|---|---|---|---|
| 2025 | $1,374 | $50,388 | $2,800 | $47,588 |
| 2024 | $1,154 | $42,308 | $2,800 | $39,508 |
| 2023 | $1,117 | $40,948 | $2,800 | $38,148 |
| 2022 | $1,049 | $37,588 | $2,800 | $34,788 |
| 2021 | $1,082 | $35,884 | $2,800 | $33,084 |
| 2020 | $1,082 | $35,884 | $2,800 | $33,084 |
| 2019 | $1,021 | $33,868 | $2,800 | $31,068 |
| 2018 | $1,009 | $33,452 | $2,824 | $30,628 |
| 2017 | $1,009 | $33,452 | $2,824 | $30,628 |
| 2016 | $989 | $32,780 | $2,824 | $29,956 |
| 2015 | $990 | $32,780 | $2,824 | $29,956 |
| 2014 | $944 | $31,204 | $2,824 | $28,380 |
| 2013 | -- | $33,490 | $2,824 | $30,666 |
Source: Public Records
Map
Nearby Homes
Your Personal Tour Guide
Ask me questions while you tour the home.