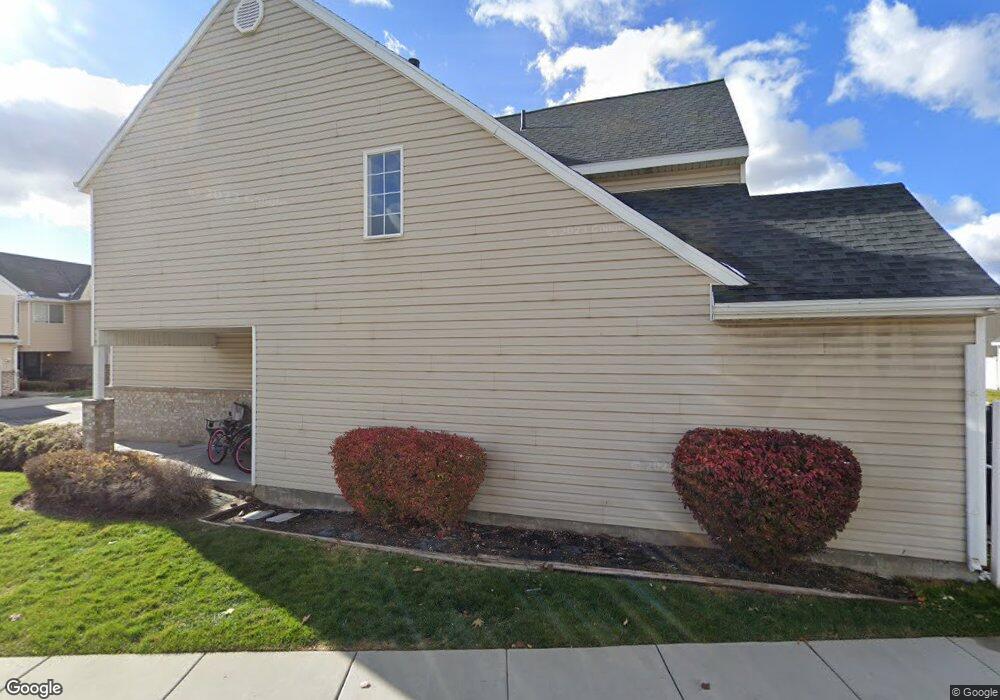
903 N 1125 W Layton, UT 84041
Estimated Value: $339,000 - $400,000
3
Beds
3
Baths
1,354
Sq Ft
$266/Sq Ft
Est. Value
About This Home
This home is located at 903 N 1125 W, Layton, UT 84041 and is currently estimated at $360,753, approximately $266 per square foot. 903 N 1125 W is a home located in Davis County with nearby schools including Central Davis Junior High School, Layton High School, and North Davis Preparatory Academy.
Ownership History
Date
Name
Owned For
Owner Type
Purchase Details
Closed on
Dec 11, 2019
Sold by
Rodriguez Maria V and Rodr1guez Leandro Z
Bought by
Rodriguez Maria and Rodriguez Leandro
Current Estimated Value
Home Financials for this Owner
Home Financials are based on the most recent Mortgage that was taken out on this home.
Original Mortgage
$203,250
Outstanding Balance
$179,162
Interest Rate
3.7%
Mortgage Type
New Conventional
Estimated Equity
$181,591
Purchase Details
Closed on
Dec 27, 2018
Sold by
Citte Debra L
Bought by
Rodriguez Maria V and Rodriguez Leandro Z
Home Financials for this Owner
Home Financials are based on the most recent Mortgage that was taken out on this home.
Original Mortgage
$198,850
Interest Rate
4.9%
Mortgage Type
New Conventional
Purchase Details
Closed on
Dec 9, 2004
Sold by
Legacy Village Llc
Bought by
Citte Debra L
Home Financials for this Owner
Home Financials are based on the most recent Mortgage that was taken out on this home.
Original Mortgage
$105,925
Interest Rate
5.64%
Mortgage Type
Purchase Money Mortgage
Create a Home Valuation Report for This Property
The Home Valuation Report is an in-depth analysis detailing your home's value as well as a comparison with similar homes in the area
Home Values in the Area
Average Home Value in this Area
Purchase History
| Date | Buyer | Sale Price | Title Company |
|---|---|---|---|
| Rodriguez Maria | -- | Novation Title Ins Ag | |
| Rodriguez Maria V | -- | Mountain America Titl | |
| Citte Debra L | -- | Meridian Title Company |
Source: Public Records
Mortgage History
| Date | Status | Borrower | Loan Amount |
|---|---|---|---|
| Open | Rodriguez Maria | $203,250 | |
| Closed | Rodriguez Maria V | $198,850 | |
| Previous Owner | Citte Debra L | $105,925 |
Source: Public Records
Tax History Compared to Growth
Tax History
| Year | Tax Paid | Tax Assessment Tax Assessment Total Assessment is a certain percentage of the fair market value that is determined by local assessors to be the total taxable value of land and additions on the property. | Land | Improvement |
|---|---|---|---|---|
| 2025 | $1,661 | $174,350 | $57,200 | $117,150 |
| 2024 | $1,633 | $172,700 | $43,450 | $129,250 |
| 2023 | $1,615 | $301,000 | $76,000 | $225,000 |
| 2022 | $1,630 | $165,000 | $40,150 | $124,850 |
| 2021 | $1,590 | $240,000 | $60,000 | $180,000 |
| 2020 | $1,450 | $210,000 | $58,800 | $151,200 |
| 2019 | $1,389 | $197,000 | $56,500 | $140,500 |
| 2018 | $1,194 | $170,000 | $50,000 | $120,000 |
| 2016 | $995 | $73,095 | $15,400 | $57,695 |
| 2015 | $1,008 | $70,290 | $15,400 | $54,890 |
| 2014 | $1,032 | $73,586 | $18,333 | $55,253 |
| 2013 | -- | $77,090 | $15,400 | $61,690 |
Source: Public Records
Map
Nearby Homes
- 1171 W Gordon Ave
- 1113 W Angel Hill Ct
- 1259 W 1050 N
- 1677 N 1600 W Unit 134
- 1366 N Main St Unit 5
- 1133 Laytona Dr
- 1254 Marilyn Dr
- 1187 W Seraphim Ct
- 526 King St Unit 2
- 1456 Scott Cir
- 1500 N Angel St Unit 12
- 1493 Marilyn Dr
- Fremont Plan at Trailside
- Blakely Plan at Trailside
- Arlington Plan at Trailside
- Savannah Plan at Trailside
- Charlotte Plan at Trailside
- Birmingham Plan at Trailside
- Oakridge Plan at Trailside
- Middleton Plan at Trailside
- 905 N 1125 W
- 905 N 1125 W Unit 409
- 901 N 1125 W
- 901 N 1125 W Unit 407
- 907 N 1125 W
- 907 N 1125 W Unit 410
- 909 N 1125 W
- 909 N 1125 W Unit 411
- 911 N 1125 W Unit 412
- 919 N 1125 W
- 923 N 1125 W
- 881 N 1125 W
- 879 N 1125 W
- 927 N 1125 W
- 883 N 1125 W
- 914 N 1125 W
- 885 N 1125 W
- 887 N 1125 W
- 906 N 1125 W
- 922 N 1125 W