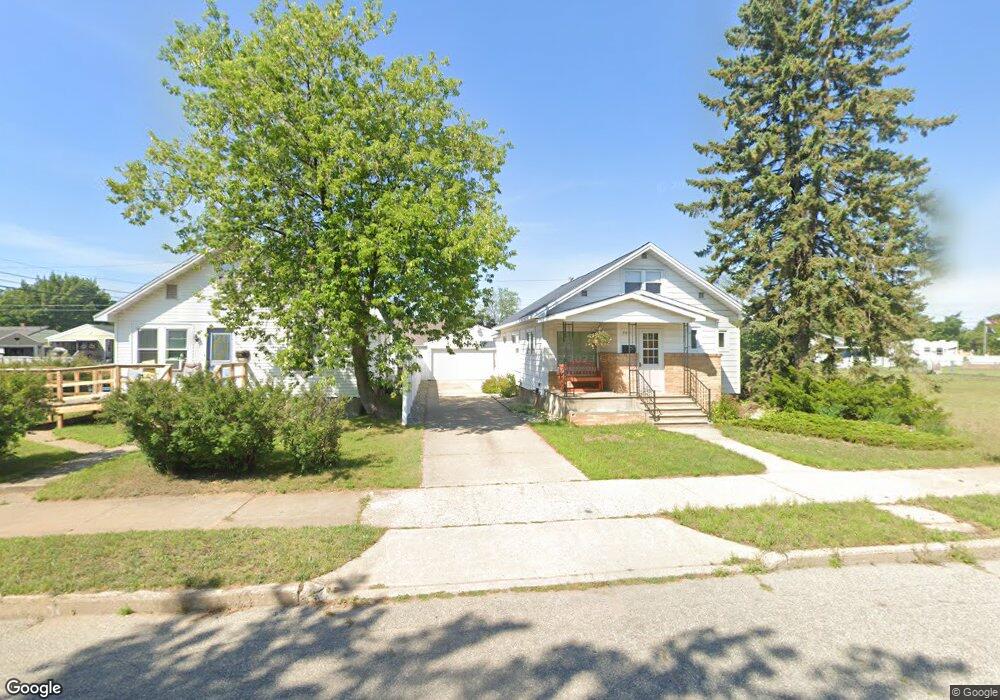
903 N 19th St Escanaba, MI 49829
Estimated Value: $173,561 - $195,000
3
Beds
2
Baths
1,486
Sq Ft
$123/Sq Ft
Est. Value
About This Home
This home is located at 903 N 19th St, Escanaba, MI 49829 and is currently estimated at $182,140, approximately $122 per square foot. 903 N 19th St is a home located in Delta County with nearby schools including Escanaba Jr./Sr. High School, Holy Name Catholic School, and Escanaba Sda School.
Ownership History
Date
Name
Owned For
Owner Type
Purchase Details
Closed on
Feb 26, 2010
Sold by
Jacobsen Justin L
Bought by
Prevost Daniel R
Current Estimated Value
Home Financials for this Owner
Home Financials are based on the most recent Mortgage that was taken out on this home.
Original Mortgage
$94,999
Outstanding Balance
$63,058
Interest Rate
5.01%
Mortgage Type
VA
Estimated Equity
$119,082
Purchase Details
Closed on
Jun 15, 2005
Bought by
Jacobson
Purchase Details
Closed on
Nov 1, 1999
Bought by
Vitito
Create a Home Valuation Report for This Property
The Home Valuation Report is an in-depth analysis detailing your home's value as well as a comparison with similar homes in the area
Home Values in the Area
Average Home Value in this Area
Purchase History
| Date | Buyer | Sale Price | Title Company |
|---|---|---|---|
| Prevost Daniel R | -- | -- | |
| Jacobson | $93,000 | -- | |
| Vitito | $78,000 | -- |
Source: Public Records
Mortgage History
| Date | Status | Borrower | Loan Amount |
|---|---|---|---|
| Open | Prevost Daniel R | $94,999 |
Source: Public Records
Tax History Compared to Growth
Tax History
| Year | Tax Paid | Tax Assessment Tax Assessment Total Assessment is a certain percentage of the fair market value that is determined by local assessors to be the total taxable value of land and additions on the property. | Land | Improvement |
|---|---|---|---|---|
| 2025 | $2,171 | $76,400 | $0 | $0 |
| 2024 | $1,650 | $63,800 | $0 | $0 |
| 2023 | $1,573 | $56,800 | $0 | $0 |
| 2022 | $2,008 | $49,500 | $0 | $0 |
| 2021 | $1,935 | $47,100 | $0 | $0 |
| 2020 | $1,917 | $47,200 | $0 | $0 |
| 2019 | $1,856 | $44,900 | $0 | $0 |
| 2018 | $1,813 | $44,500 | $0 | $0 |
| 2017 | $1,324 | $42,665 | $0 | $0 |
| 2016 | $1,739 | $42,903 | $0 | $0 |
| 2014 | $1,277 | $41,289 | $0 | $0 |
| 2013 | $1,277 | $40,946 | $0 | $0 |
Source: Public Records
Map
Nearby Homes