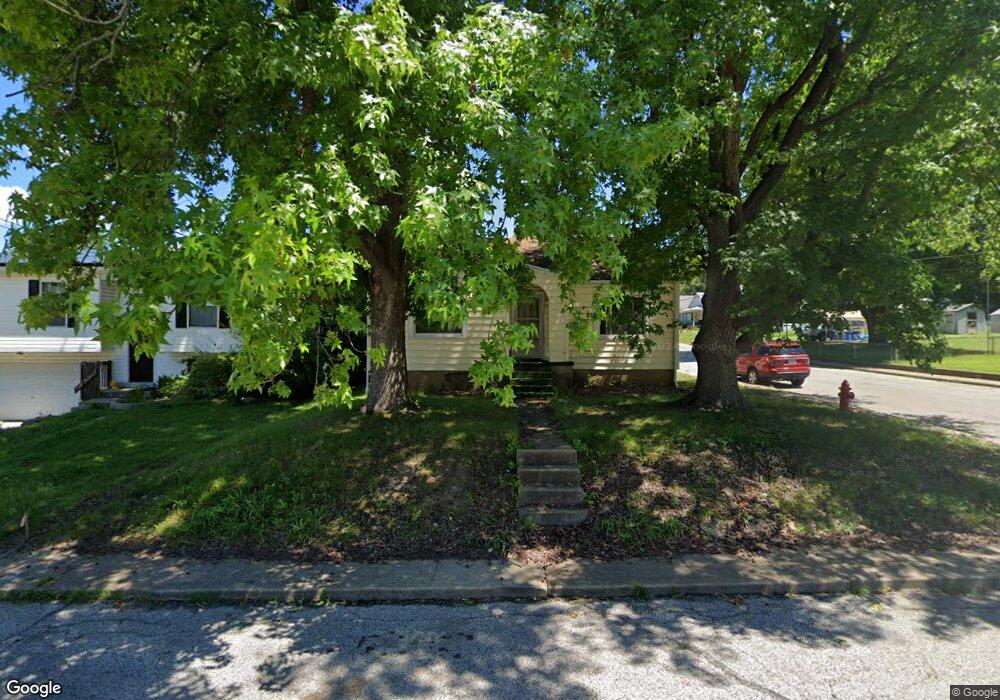
903 N 6th St Festus, MO 63028
Festus/Crystal City NeighborhoodEstimated Value: $119,608 - $195,000
--
Bed
--
Bath
1,100
Sq Ft
$149/Sq Ft
Est. Value
About This Home
This home is located at 903 N 6th St, Festus, MO 63028 and is currently estimated at $163,902, approximately $149 per square foot. 903 N 6th St is a home with nearby schools including Festus Elementary School, Festus Intermediate School, and Festus Middle School.
Ownership History
Date
Name
Owned For
Owner Type
Purchase Details
Closed on
Jul 28, 2010
Sold by
Bayer Francis
Bought by
Allen Barbara Ann
Current Estimated Value
Purchase Details
Closed on
May 7, 2008
Sold by
Allen Barbara Ann and Loge Barbara Ann
Bought by
Allen Barbara Ann
Home Financials for this Owner
Home Financials are based on the most recent Mortgage that was taken out on this home.
Original Mortgage
$123,424
Interest Rate
5.89%
Mortgage Type
New Conventional
Create a Home Valuation Report for This Property
The Home Valuation Report is an in-depth analysis detailing your home's value as well as a comparison with similar homes in the area
Home Values in the Area
Average Home Value in this Area
Purchase History
| Date | Buyer | Sale Price | Title Company |
|---|---|---|---|
| Allen Barbara Ann | -- | None Available | |
| Allen Barbara Ann | -- | Nations Title Agency Mo Inc |
Source: Public Records
Mortgage History
| Date | Status | Borrower | Loan Amount |
|---|---|---|---|
| Previous Owner | Allen Barbara Ann | $123,424 |
Source: Public Records
Tax History Compared to Growth
Tax History
| Year | Tax Paid | Tax Assessment Tax Assessment Total Assessment is a certain percentage of the fair market value that is determined by local assessors to be the total taxable value of land and additions on the property. | Land | Improvement |
|---|---|---|---|---|
| 2025 | $753 | $13,800 | $1,500 | $12,300 |
| 2024 | $753 | $13,300 | $1,500 | $11,800 |
| 2023 | $753 | $13,300 | $1,500 | $11,800 |
| 2022 | $750 | $13,300 | $1,500 | $11,800 |
| 2021 | $750 | $13,300 | $1,500 | $11,800 |
| 2020 | $721 | $12,000 | $1,200 | $10,800 |
| 2019 | $721 | $12,000 | $1,200 | $10,800 |
| 2018 | $650 | $12,000 | $1,200 | $10,800 |
| 2017 | $650 | $12,000 | $1,200 | $10,800 |
| 2016 | $577 | $10,600 | $1,300 | $9,300 |
| 2015 | $574 | $10,600 | $1,300 | $9,300 |
| 2013 | -- | $10,100 | $1,300 | $8,800 |
Source: Public Records
Map
Nearby Homes