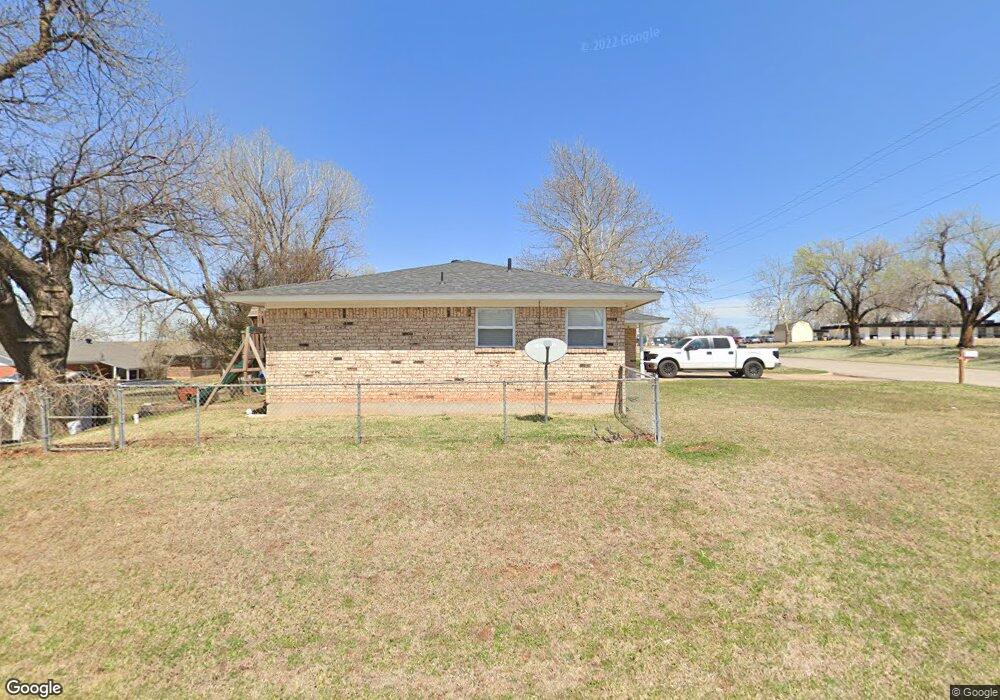
903 N 8th Ave Purcell, OK 73080
Estimated Value: $172,000 - $207,000
2
Beds
2
Baths
1,165
Sq Ft
$157/Sq Ft
Est. Value
About This Home
This home is located at 903 N 8th Ave, Purcell, OK 73080 and is currently estimated at $183,361, approximately $157 per square foot. 903 N 8th Ave is a home located in McClain County with nearby schools including Purcell Elementary School, Purcell Intermediate School, and Purcell Junior High School.
Ownership History
Date
Name
Owned For
Owner Type
Purchase Details
Closed on
Nov 18, 2016
Sold by
Sei Holdings Inc
Bought by
Zaragoza Michael Minor
Current Estimated Value
Home Financials for this Owner
Home Financials are based on the most recent Mortgage that was taken out on this home.
Original Mortgage
$103,535
Outstanding Balance
$83,121
Interest Rate
3.42%
Mortgage Type
New Conventional
Estimated Equity
$100,240
Purchase Details
Closed on
Aug 5, 2016
Sold by
Collett Jennifer and Collett Ryan
Bought by
Sei Holdings Inc
Purchase Details
Closed on
Sep 18, 2009
Sold by
Klepper James M and Klepper Tommy D
Bought by
Vigil Jennifer and Vigil Patricio
Home Financials for this Owner
Home Financials are based on the most recent Mortgage that was taken out on this home.
Original Mortgage
$79,873
Interest Rate
5.2%
Mortgage Type
FHA
Create a Home Valuation Report for This Property
The Home Valuation Report is an in-depth analysis detailing your home's value as well as a comparison with similar homes in the area
Home Values in the Area
Average Home Value in this Area
Purchase History
| Date | Buyer | Sale Price | Title Company |
|---|---|---|---|
| Zaragoza Michael Minor | $102,500 | None Available | |
| Sei Holdings Inc | $84,000 | None Available | |
| Vigil Jennifer | $94,500 | None Available |
Source: Public Records
Mortgage History
| Date | Status | Borrower | Loan Amount |
|---|---|---|---|
| Open | Zaragoza Michael Minor | $103,535 | |
| Previous Owner | Vigil Jennifer | $79,873 |
Source: Public Records
Tax History Compared to Growth
Tax History
| Year | Tax Paid | Tax Assessment Tax Assessment Total Assessment is a certain percentage of the fair market value that is determined by local assessors to be the total taxable value of land and additions on the property. | Land | Improvement |
|---|---|---|---|---|
| 2024 | $1,554 | $14,307 | $1,483 | $12,824 |
| 2023 | $1,554 | $13,626 | $1,471 | $12,155 |
| 2022 | $1,393 | $12,977 | $1,375 | $11,602 |
| 2021 | $1,347 | $12,395 | $1,375 | $11,020 |
| 2020 | $1,283 | $11,920 | $1,375 | $10,545 |
| 2019 | $1,257 | $11,467 | $1,375 | $10,092 |
| 2018 | $1,250 | $11,507 | $1,375 | $10,132 |
| 2017 | $1,197 | $11,275 | $1,100 | $10,175 |
| 2016 | $1,294 | $12,039 | $1,067 | $10,972 |
| 2015 | $1,252 | $11,465 | $1,040 | $10,425 |
| 2014 | $1,180 | $10,919 | $996 | $9,923 |
Source: Public Records
Map
Nearby Homes
- 801 W Van Buren St
- 613 W Taylor St
- 515 W Jackson St
- 1027 W Windsor Way
- 517 Bob White Dr
- 0000 N Green Ave
- 0000 Jackson St
- 922 Blue Bird Terrace
- 941 Blue Bird Terrace
- 302 W Harrison St
- 1205 Meadow Brook Dr
- 1209 Meadow Brook Dr
- 1224 S Brook Dr
- 1220 S Brook Dr
- Rc Mitchell Plan at Southbrook
- Rc Cooper Plan at Southbrook
- Rc Keswick Plan at Southbrook
- RC Ridgeland Plan at Southbrook
- RC Tucson Plan at Southbrook
- Rc Chelsey Plan at Southbrook