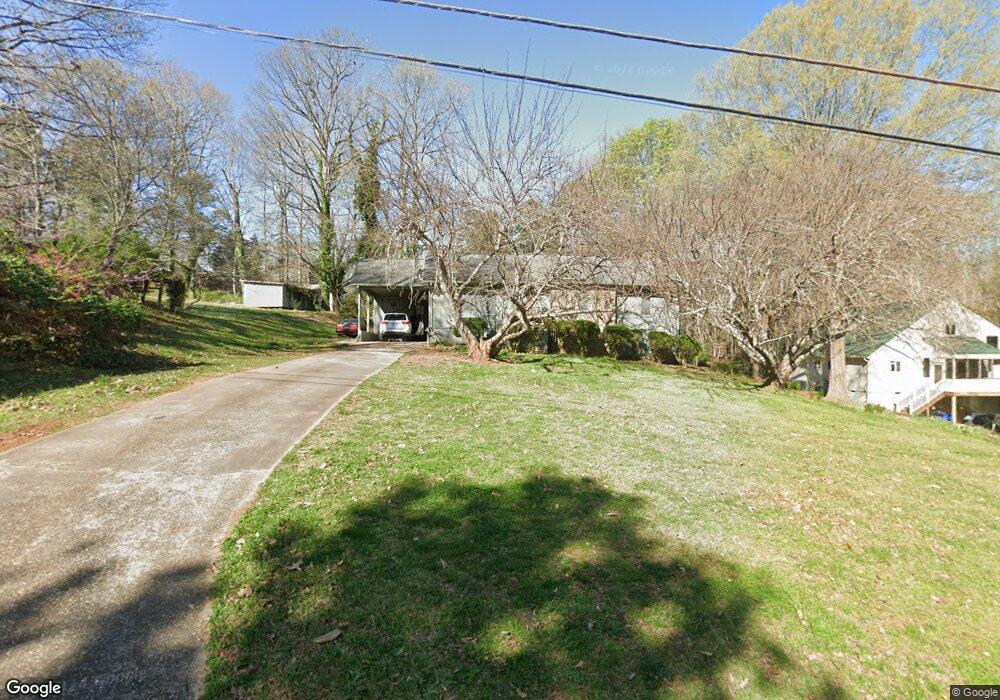
903 N Glenn Ave Siler City, NC 27344
Estimated Value: $219,000 - $255,000
3
Beds
2
Baths
1,590
Sq Ft
$150/Sq Ft
Est. Value
About This Home
This home is located at 903 N Glenn Ave, Siler City, NC 27344 and is currently estimated at $238,425, approximately $149 per square foot. 903 N Glenn Ave is a home located in Chatham County with nearby schools including Siler City Elementary School, Chatham Middle, and Jordan Matthews High.
Ownership History
Date
Name
Owned For
Owner Type
Purchase Details
Closed on
Aug 20, 2023
Sold by
Alexander Ian and Alexander Britta S
Bought by
Alexander Ian
Current Estimated Value
Home Financials for this Owner
Home Financials are based on the most recent Mortgage that was taken out on this home.
Original Mortgage
$100,106
Outstanding Balance
$97,727
Interest Rate
6.81%
Mortgage Type
New Conventional
Estimated Equity
$140,698
Purchase Details
Closed on
Mar 24, 2020
Sold by
White Patti Harris and White Paul S
Bought by
Alexander Ian and Alexander Britta S
Purchase Details
Closed on
Oct 14, 2016
Sold by
Harris Nubie
Bought by
Harris Nubie and White Patti Harris
Create a Home Valuation Report for This Property
The Home Valuation Report is an in-depth analysis detailing your home's value as well as a comparison with similar homes in the area
Home Values in the Area
Average Home Value in this Area
Purchase History
| Date | Buyer | Sale Price | Title Company |
|---|---|---|---|
| Alexander Ian | -- | None Listed On Document | |
| Alexander Ian | -- | None Listed On Document | |
| Alexander Ian | $140,000 | None Available | |
| Harris Nubie | -- | Attorney |
Source: Public Records
Mortgage History
| Date | Status | Borrower | Loan Amount |
|---|---|---|---|
| Open | Alexander Ian | $100,106 | |
| Closed | Alexander Ian | $100,106 |
Source: Public Records
Tax History Compared to Growth
Tax History
| Year | Tax Paid | Tax Assessment Tax Assessment Total Assessment is a certain percentage of the fair market value that is determined by local assessors to be the total taxable value of land and additions on the property. | Land | Improvement |
|---|---|---|---|---|
| 2025 | $2,474 | $194,547 | $35,040 | $159,507 |
| 2024 | $2,474 | $130,244 | $29,200 | $101,044 |
| 2023 | $1,648 | $130,244 | $29,200 | $101,044 |
| 2022 | $1,569 | $130,244 | $29,200 | $101,044 |
| 2021 | $1,569 | $130,244 | $29,200 | $101,044 |
| 2020 | $1,567 | $129,539 | $24,500 | $105,039 |
| 2019 | $1,567 | $129,539 | $24,500 | $105,039 |
| 2018 | $1,474 | $129,539 | $24,500 | $105,039 |
| 2017 | $1,474 | $129,539 | $24,500 | $105,039 |
| 2016 | $1,472 | $132,170 | $25,000 | $107,170 |
| 2015 | -- | $132,170 | $25,000 | $107,170 |
| 2014 | -- | $132,170 | $25,000 | $107,170 |
| 2013 | -- | $132,170 | $25,000 | $107,170 |
Source: Public Records
Map
Nearby Homes
- 1007 Driftwood Dr
- 806 Cliftwood Dr
- 803 Woodland Dr
- 1004 Candlewood Cir
- 0 W 3rd St
- Tbd W 3rd St
- 1306 Sunset Dr
- 1501 Duet Dr
- 519 W Raleigh St
- 1707 N Chatham Ave
- 2200 W 3rd St
- 2248 W 3rd St
- 0 Airport Rd Unit 10131777
- 128 Olde Manor Ct
- 513 W Glendale St
- 303 W Dolphin St
- 409 E 10th St
- TBD E 3rd St
- 701 S Chatham Ave
- 3125 W 3rd St
- 905 N Glenn Ave
- 901 N Glenn Ave
- 906 Shannon Dr
- 712 N Ivey Ave
- 904 Lake Dr
- 810 N Glenn Ave
- 810 N Glenn Ave
- 910 Shannon Dr
- 808 N Glenn Ave
- 807 N Glenn Ave
- 0 Cliftwood Dr Unit 690765
- 0 Cliftwood Dr Unit 690770
- 0 Cliftwood Dr Unit 1875927
- 0 Cliftwood Dr Unit 1875916
- 0 Cliftwood Dr Unit 1875910
- 0 Cliftwood Dr Unit TR2004765
- 804 Cliftwood Dr
- 0 Cliftwood Dr Unit 126 1875927
- 0 Cliftwood Dr Unit 124 1875910
- 0 Cliftwood Dr Unit 125 1875916