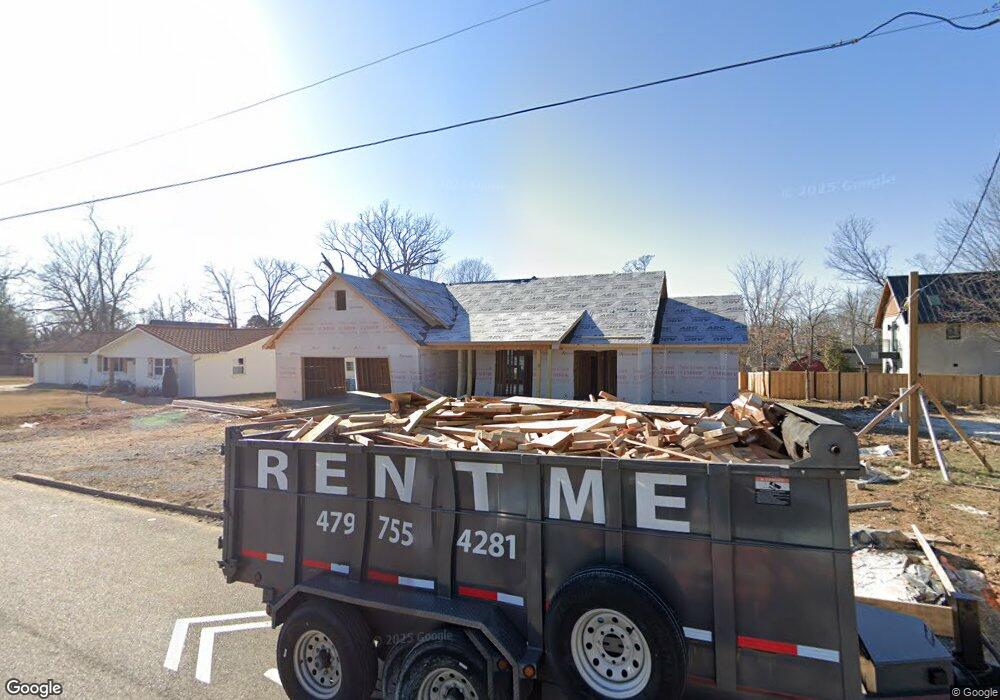
903 NW B St Bentonville, AR 72712
Estimated Value: $660,000 - $1,343,000
4
Beds
2
Baths
1,800
Sq Ft
$556/Sq Ft
Est. Value
About This Home
This home is located at 903 NW B St, Bentonville, AR 72712 and is currently estimated at $1,001,500, approximately $556 per square foot. 903 NW B St is a home located in Benton County with nearby schools including Sugar Creek Elementary School, Lincoln Junior High School, and Old High Middle School.
Ownership History
Date
Name
Owned For
Owner Type
Purchase Details
Closed on
Sep 27, 2016
Sold by
Lasley Mary J and Lasley David L
Bought by
Lasley Mary J
Current Estimated Value
Purchase Details
Closed on
Apr 5, 1999
Bought by
Lasley
Purchase Details
Closed on
Aug 3, 1995
Purchase Details
Closed on
May 26, 1995
Bought by
Mj Snider
Purchase Details
Closed on
Jun 29, 1984
Bought by
Snider
Purchase Details
Closed on
Apr 2, 1979
Bought by
Turner
Create a Home Valuation Report for This Property
The Home Valuation Report is an in-depth analysis detailing your home's value as well as a comparison with similar homes in the area
Home Values in the Area
Average Home Value in this Area
Purchase History
| Date | Buyer | Sale Price | Title Company |
|---|---|---|---|
| Lasley Mary J | -- | None Available | |
| Lasley | -- | -- | |
| -- | -- | -- | |
| Mj Snider | -- | -- | |
| Snider | -- | -- | |
| Turner | -- | -- |
Source: Public Records
Tax History Compared to Growth
Tax History
| Year | Tax Paid | Tax Assessment Tax Assessment Total Assessment is a certain percentage of the fair market value that is determined by local assessors to be the total taxable value of land and additions on the property. | Land | Improvement |
|---|---|---|---|---|
| 2025 | $1,750 | $86,020 | $86,020 | -- |
| 2024 | $1,598 | $86,020 | $86,020 | $0 |
| 2023 | $1,598 | $118,050 | $78,320 | $39,730 |
| 2022 | $1,262 | $118,050 | $78,320 | $39,730 |
| 2021 | $1,257 | $118,050 | $78,320 | $39,730 |
| 2020 | $1,272 | $30,950 | $3,800 | $27,150 |
| 2019 | $1,272 | $30,950 | $3,800 | $27,150 |
| 2018 | $1,297 | $30,950 | $3,800 | $27,150 |
| 2017 | $1,297 | $30,950 | $3,800 | $27,150 |
| 2016 | $1,246 | $30,950 | $3,800 | $27,150 |
| 2015 | $1,522 | $24,630 | $4,000 | $20,630 |
| 2014 | $1,172 | $24,630 | $4,000 | $20,630 |
Source: Public Records
Map
Nearby Homes