
Seller's Agent in 2025
Jason Boothe
MOUNTAIN VIEW REAL ESTATE LLC
(540) 204-5818
36 in this area
294 Total Sales


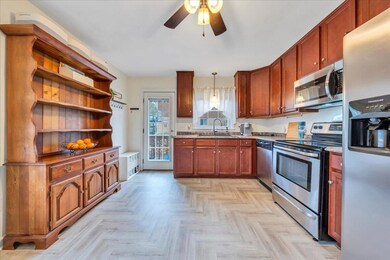

Don't miss out on this exceptional 4-bedroom, 2-bath home located in the sought-after Bali Hai subdivision in Vinton! Brand New Carpet: The entire downstairs features brand new carpeting, offering a fresh and welcoming ambiance.Updated Bathrooms: Enjoy modern comforts with updates in the downstairs bathroom.New Kitchen Flooring: The kitchen has been recently updated with new flooring that perfectly complements the home's style.New AC: The air conditioning system was replaced in 2020, ensuring efficient cooling during the hot summer months.Beautiful Lot with Views: This home sits on a spacious lot with stunning views, perfect for relaxation.Fenced Backyard: Enjoy privacy and safety in the fenced backyard.Oversized Deck: Ideal for grilling and outdoor entertaining, the oversized
Last Agent to Sell the Property
MOUNTAIN VIEW REAL ESTATE LLC License #0225240064 Listed on: 03/27/2025
| Date | Type | Sale Price | Title Company |
|---|---|---|---|
| Deed | $309,950 | Virginia Title Center | |
| Deed | $164,000 | Fidelity Natl Title Ins Co | |
| Deed | $115,500 | None Available | |
| Deed | $154,450 | None Available |
| Date | Status | Loan Amount | Loan Type |
|---|---|---|---|
| Open | $309,950 | New Conventional | |
| Previous Owner | $147,600 | New Conventional | |
| Previous Owner | $30,900 | Stand Alone Second |
| Date | Event | Price | List to Sale | Price per Sq Ft | Prior Sale |
|---|---|---|---|---|---|
| 06/17/2025 06/17/25 | Sold | $309,950 | 0.0% | $138 / Sq Ft | |
| 04/13/2025 04/13/25 | Pending | -- | -- | -- | |
| 04/11/2025 04/11/25 | Price Changed | $309,950 | +3.3% | $138 / Sq Ft | |
| 04/11/2025 04/11/25 | For Sale | $299,950 | +82.9% | $133 / Sq Ft | |
| 09/18/2014 09/18/14 | Sold | $164,000 | -3.5% | $78 / Sq Ft | View Prior Sale |
| 08/11/2014 08/11/14 | Pending | -- | -- | -- | |
| 07/08/2014 07/08/14 | For Sale | $169,950 | -- | $81 / Sq Ft |
| Year | Tax Paid | Tax Assessment Tax Assessment Total Assessment is a certain percentage of the fair market value that is determined by local assessors to be the total taxable value of land and additions on the property. | Land | Improvement |
|---|---|---|---|---|
| 2025 | $2,345 | $227,700 | $34,200 | $193,500 |
| 2024 | $2,235 | $214,900 | $34,200 | $180,700 |
| 2023 | $2,139 | $201,800 | $34,200 | $167,600 |
| 2022 | $1,987 | $182,300 | $34,200 | $148,100 |
| 2021 | $1,818 | $166,800 | $34,200 | $132,600 |
| 2020 | $1,721 | $157,900 | $31,500 | $126,400 |
| 2019 | $1,740 | $159,600 | $28,800 | $130,800 |
| 2018 | $1,676 | $155,100 | $27,000 | $128,100 |
| 2017 | $1,676 | $153,800 | $27,000 | $126,800 |
| 2016 | $1,667 | $152,900 | $27,000 | $125,900 |
| 2015 | $1,668 | $153,000 | $27,000 | $126,000 |
| 2014 | $1,685 | $154,600 | $27,000 | $127,600 |
Seller's Agent in 2025
Jason Boothe
MOUNTAIN VIEW REAL ESTATE LLC
(540) 204-5818
36 in this area
294 Total Sales
Seller Co-Listing Agent in 2025
David Bell
MOUNTAIN VIEW REAL ESTATE LLC
(540) 537-6700
9 in this area
155 Total Sales
Buyer's Agent in 2025
Rob Thacker
KELLER WILLIAMS REALTY - NRV
(615) 804-8449
1 in this area
54 Total Sales
Buyer Co-Listing Agent in 2025
Kim Thacker
KELLER WILLIAMS REALTY - NRV
(615) 522-4134
1 in this area
79 Total Sales
Seller's Agent in 2014
Renee Wiggins
RE/MAX
(540) 314-4294
1 in this area
72 Total Sales
Buyer's Agent in 2014
Grant Cockrell
RE/MAX
(540) 580-8232
4 in this area
188 Total Sales
Source: Roanoke Valley Association of REALTORS®
MLS Number: 915660
APN: 061.09-02-08
Disclaimer: Certain information contained herein is derived from information provided by parties other than Homes.com. All information provided is deemed reliable, but is not guaranteed to be accurate and should be independently verified.
![]() IDX information is provided exclusively for personal, non-commercial use, and may not be used for any purpose other than to identify prospective properties consumers may be interested in purchasing. Information is deemed reliable but not guaranteed.
IDX information is provided exclusively for personal, non-commercial use, and may not be used for any purpose other than to identify prospective properties consumers may be interested in purchasing. Information is deemed reliable but not guaranteed.
Ask me questions while you tour the home.