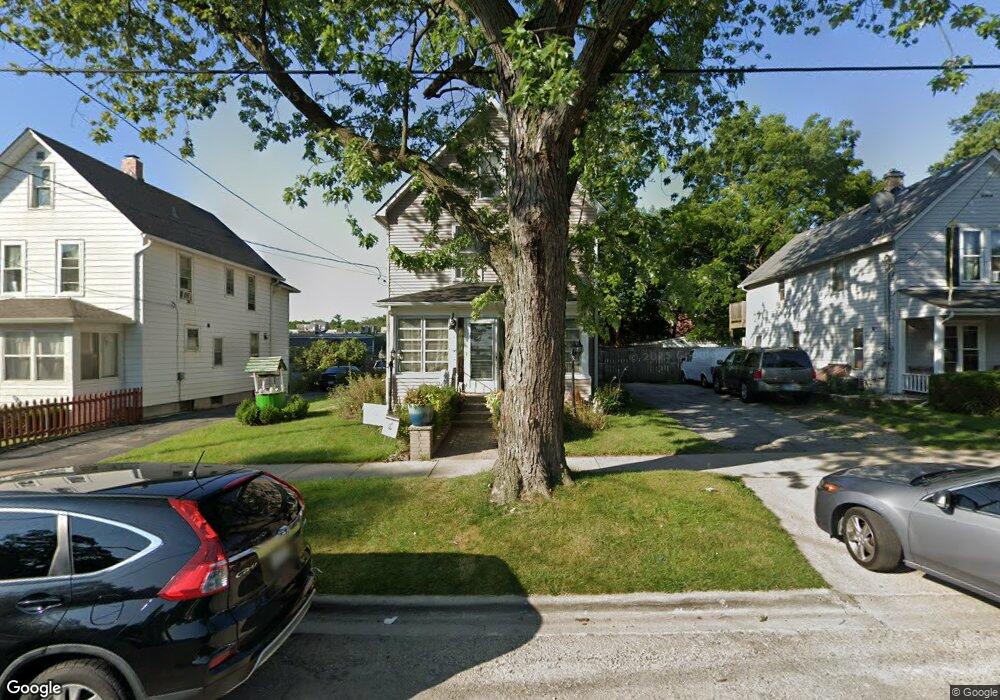
903 Porter St Waukegan, IL 60085
Estimated Value: $210,000 - $270,000
3
Beds
1
Bath
1,426
Sq Ft
$167/Sq Ft
Est. Value
About This Home
This home is located at 903 Porter St, Waukegan, IL 60085 and is currently estimated at $238,160, approximately $167 per square foot. 903 Porter St is a home located in Lake County with nearby schools including Glen Flora Elementary School, Edith M Smith Middle School, and Waukegan High School.
Ownership History
Date
Name
Owned For
Owner Type
Purchase Details
Closed on
Aug 25, 2000
Sold by
Sexton Lloyd and Sexton Gloria
Bought by
Ruiz Alejandro and Ruiz Marcela H
Current Estimated Value
Home Financials for this Owner
Home Financials are based on the most recent Mortgage that was taken out on this home.
Original Mortgage
$103,400
Outstanding Balance
$38,113
Interest Rate
8.26%
Estimated Equity
$200,047
Purchase Details
Closed on
Oct 1, 1996
Sold by
Stittgen Ellene
Bought by
Sexton Lloyd and Sexton Gloria
Create a Home Valuation Report for This Property
The Home Valuation Report is an in-depth analysis detailing your home's value as well as a comparison with similar homes in the area
Home Values in the Area
Average Home Value in this Area
Purchase History
| Date | Buyer | Sale Price | Title Company |
|---|---|---|---|
| Ruiz Alejandro | $115,000 | First American Title | |
| Sexton Lloyd | -- | -- |
Source: Public Records
Mortgage History
| Date | Status | Borrower | Loan Amount |
|---|---|---|---|
| Open | Ruiz Alejandro | $103,400 |
Source: Public Records
Tax History Compared to Growth
Tax History
| Year | Tax Paid | Tax Assessment Tax Assessment Total Assessment is a certain percentage of the fair market value that is determined by local assessors to be the total taxable value of land and additions on the property. | Land | Improvement |
|---|---|---|---|---|
| 2024 | $4,145 | $57,677 | $8,935 | $48,742 |
| 2023 | $4,029 | $51,958 | $7,999 | $43,959 |
| 2022 | $4,029 | $47,211 | $7,608 | $39,603 |
| 2021 | $3,624 | $40,758 | $6,787 | $33,971 |
| 2020 | $3,624 | $37,971 | $6,323 | $31,648 |
| 2019 | $3,595 | $34,794 | $5,794 | $29,000 |
| 2018 | $3,256 | $31,562 | $7,381 | $24,181 |
| 2017 | $3,119 | $27,923 | $6,530 | $21,393 |
| 2016 | $2,822 | $24,264 | $5,674 | $18,590 |
| 2015 | $2,655 | $21,716 | $5,078 | $16,638 |
| 2014 | $2,456 | $20,054 | $3,833 | $16,221 |
| 2012 | $3,264 | $21,727 | $4,153 | $17,574 |
Source: Public Records
Map
Nearby Homes
- 511 Chestnut St
- 428 N Poplar St
- 522 N Poplar St
- 702 Franklin St
- 620 N Poplar St
- 452 North Ave
- 1109 Massena Ave
- 917 N Linden Ave
- 426 Julian St
- 824 N Butrick St
- 918 N Ash St
- 325 4th St
- 28 N Saint James St
- 1000 Pine St
- 23 N Jackson St
- 1416 Hamilton Ct
- 1110 N Ash St
- 723 N County St
- 415 W Ridgeland Ave
- 222 Grand Ave