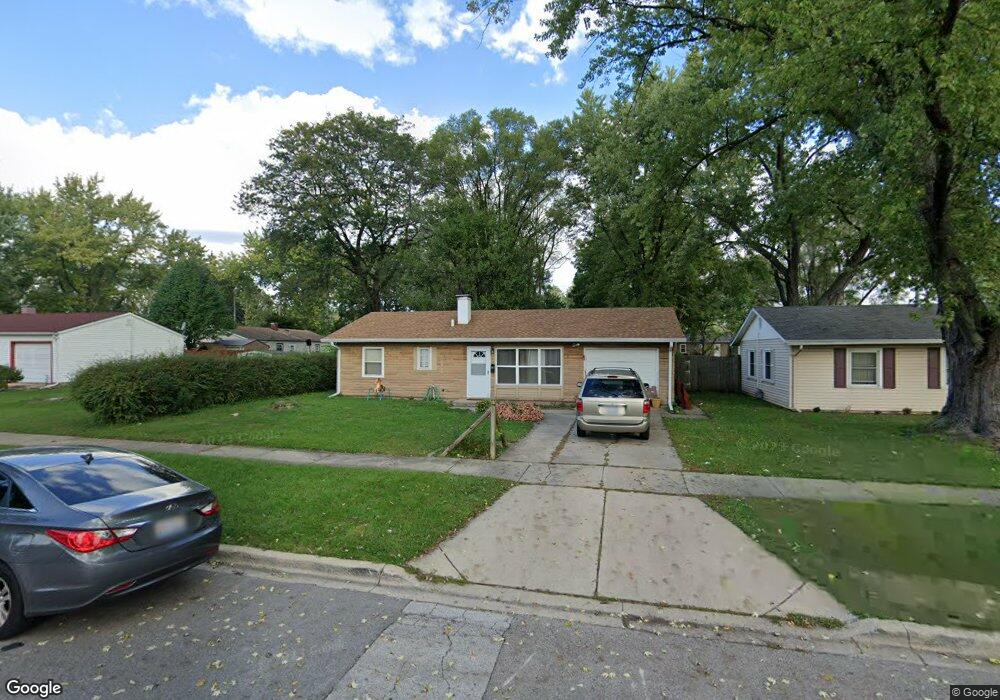
903 Robert St Aurora, IL 60506
North River NeighborhoodEstimated Value: $227,207 - $237,000
3
Beds
1
Bath
864
Sq Ft
$268/Sq Ft
Est. Value
About This Home
This home is located at 903 Robert St, Aurora, IL 60506 and is currently estimated at $231,302, approximately $267 per square foot. 903 Robert St is a home located in Kane County with nearby schools including Smith Elementary School, Jewel Middle School, and West Aurora High School.
Ownership History
Date
Name
Owned For
Owner Type
Purchase Details
Closed on
Jun 28, 2016
Sold by
Cepeda Maria and Fuentes Sandra A
Bought by
Cepeda Maria
Current Estimated Value
Home Financials for this Owner
Home Financials are based on the most recent Mortgage that was taken out on this home.
Original Mortgage
$113,050
Outstanding Balance
$71,516
Interest Rate
3.75%
Mortgage Type
New Conventional
Estimated Equity
$159,786
Purchase Details
Closed on
Sep 29, 2008
Sold by
Sharpe Lydia and Lowers Lee
Bought by
Cepeda Maria and Fuentes Sandra A
Home Financials for this Owner
Home Financials are based on the most recent Mortgage that was taken out on this home.
Original Mortgage
$127,991
Interest Rate
6.19%
Mortgage Type
FHA
Purchase Details
Closed on
Dec 19, 2001
Sold by
Carsey William L and Carsey Judith A
Bought by
Sharpe Lydia and Lowers Lee
Home Financials for this Owner
Home Financials are based on the most recent Mortgage that was taken out on this home.
Original Mortgage
$118,838
Interest Rate
6.92%
Mortgage Type
FHA
Create a Home Valuation Report for This Property
The Home Valuation Report is an in-depth analysis detailing your home's value as well as a comparison with similar homes in the area
Home Values in the Area
Average Home Value in this Area
Purchase History
| Date | Buyer | Sale Price | Title Company |
|---|---|---|---|
| Cepeda Maria | -- | Chicago Title | |
| Cepeda Maria | $130,000 | First American Title | |
| Sharpe Lydia | $120,000 | -- |
Source: Public Records
Mortgage History
| Date | Status | Borrower | Loan Amount |
|---|---|---|---|
| Open | Cepeda Maria | $113,050 | |
| Previous Owner | Cepeda Maria | $127,991 | |
| Previous Owner | Sharpe Lydia | $118,838 |
Source: Public Records
Tax History
| Year | Tax Paid | Tax Assessment Tax Assessment Total Assessment is a certain percentage of the fair market value that is determined by local assessors to be the total taxable value of land and additions on the property. | Land | Improvement |
|---|---|---|---|---|
| 2024 | $4,328 | $62,664 | $9,711 | $52,953 |
| 2023 | $4,111 | $55,990 | $8,677 | $47,313 |
| 2022 | $3,991 | $51,086 | $7,917 | $43,169 |
| 2021 | $3,585 | $45,238 | $7,371 | $37,867 |
| 2020 | $3,372 | $42,020 | $6,847 | $35,173 |
| 2019 | $3,220 | $38,933 | $6,344 | $32,589 |
| 2018 | $2,890 | $34,948 | $5,868 | $29,080 |
| 2017 | $2,513 | $30,413 | $5,407 | $25,006 |
| 2016 | $2,593 | $30,412 | $4,635 | $25,777 |
| 2015 | -- | $26,382 | $3,986 | $22,396 |
| 2014 | -- | $23,547 | $3,663 | $19,884 |
| 2013 | -- | $24,027 | $3,611 | $20,416 |
Source: Public Records
Map
Nearby Homes
- 847 Foran Ln
- 833 Sheldon Ave
- 1104 New Haven Ave
- 1229 Yellowpine Dr
- 1351 Monomoy St Unit D
- 500 California Ave
- 1387 S Glen Cir Unit D
- 1039 S Pleasure Ct
- 833 N Randall Rd Unit C4
- 811 N Randall Rd Unit B
- 1358 Monomoy St Unit A
- 388 Manor Place
- 1421 Heather Dr
- 603 N May St
- 418 W Illinois Ave
- 742 N Glenwood Place
- 519 N View St
- 807 Spruce St
- 950 Spruce St
- 338 Lakelawn Blvd
Your Personal Tour Guide
Ask me questions while you tour the home.