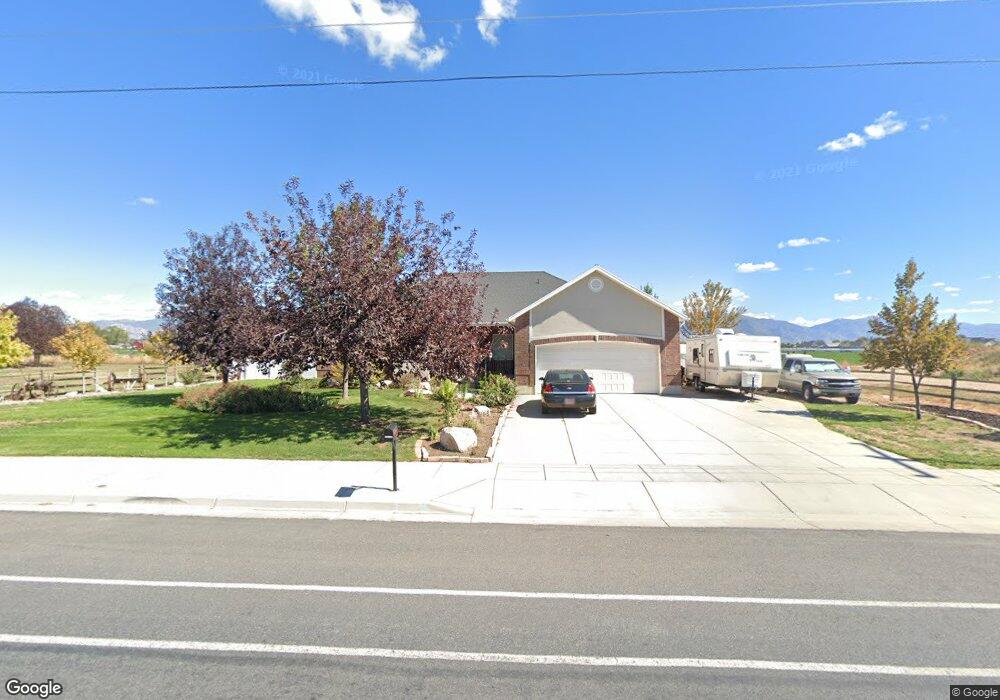
903 S 3000 W Syracuse, UT 84075
Estimated Value: $599,000 - $726,451
3
Beds
3
Baths
1,821
Sq Ft
$371/Sq Ft
Est. Value
About This Home
This home is located at 903 S 3000 W, Syracuse, UT 84075 and is currently estimated at $675,363, approximately $370 per square foot. 903 S 3000 W is a home located in Davis County with nearby schools including Syracuse Elementary School, Syracuse Junior High School, and Syracuse High School.
Ownership History
Date
Name
Owned For
Owner Type
Purchase Details
Closed on
Jun 1, 2020
Sold by
Cheney Lioyd and Cheney Karen Wiilcox
Bought by
Cheney Karen Gay Wilcox and Lloyd Nell
Current Estimated Value
Home Financials for this Owner
Home Financials are based on the most recent Mortgage that was taken out on this home.
Original Mortgage
$221,000
Interest Rate
3.3%
Mortgage Type
New Conventional
Purchase Details
Closed on
Oct 7, 2010
Sold by
Cheney Karen Gay Wilcox and Cheney Lloyd Neil
Bought by
Cheney Karen Gay Wilcox
Home Financials for this Owner
Home Financials are based on the most recent Mortgage that was taken out on this home.
Original Mortgage
$165,900
Interest Rate
4.28%
Mortgage Type
New Conventional
Purchase Details
Closed on
May 20, 2010
Sold by
Cheney Lloyd N and Cheney Karen W
Bought by
Cheney Lloyd Neil and Cheney Karen Gay Wilcox
Create a Home Valuation Report for This Property
The Home Valuation Report is an in-depth analysis detailing your home's value as well as a comparison with similar homes in the area
Home Values in the Area
Average Home Value in this Area
Purchase History
| Date | Buyer | Sale Price | Title Company |
|---|---|---|---|
| Cheney Karen Gay Wilcox | -- | Accommodation | |
| Cheney Lloyd | -- | Backman Title Service | |
| Cheney Karen Gay Wilcox | -- | Utah Commercial Title Co | |
| Cheney Karen Gay Wilcox | -- | Utah Commercial Title Co | |
| Cheney Lloyd Neil | -- | None Available |
Source: Public Records
Mortgage History
| Date | Status | Borrower | Loan Amount |
|---|---|---|---|
| Closed | Cheney Lloyd | $221,000 | |
| Closed | Cheney Karen Gay Wilcox | $165,900 |
Source: Public Records
Tax History
| Year | Tax Paid | Tax Assessment Tax Assessment Total Assessment is a certain percentage of the fair market value that is determined by local assessors to be the total taxable value of land and additions on the property. | Land | Improvement |
|---|---|---|---|---|
| 2025 | $3,905 | $376,750 | $119,274 | $257,476 |
| 2024 | $3,947 | $383,349 | $120,840 | $262,509 |
| 2023 | $3,424 | $333,300 | $114,797 | $218,502 |
| 2022 | $3,684 | $650,000 | $210,993 | $439,007 |
| 2021 | $3,176 | $477,000 | $174,860 | $302,140 |
| 2020 | $2,847 | $414,000 | $138,009 | $275,991 |
| 2019 | $2,821 | $405,000 | $152,617 | $252,383 |
| 2018 | $2,562 | $365,000 | $137,615 | $227,385 |
| 2016 | $2,186 | $163,350 | $52,177 | $111,173 |
| 2015 | $2,175 | $154,770 | $52,177 | $102,593 |
| 2014 | $2,206 | $159,991 | $52,177 | $107,814 |
| 2013 | -- | $144,635 | $52,065 | $92,570 |
Source: Public Records
Map
Nearby Homes
- 2885 W 700 S
- 2935 W 1200 S
- 2584 S 2430 St W Unit 502
- 2613 S 2430 W Unit 111
- 2614 S 2430 W Unit 106
- 2665 S 2430 W Unit 118
- 2663 S 2430 W
- 1441 Brookshire Dr
- 3546 Brookshire Dr
- 4205 W 1100 S
- 160 S 2775 W
- 2809 W 100 S
- 3805 W Jupiter Hills
- 2679 W Antelope Dr
- 2098 W 700 S
- 380 S 4300 W Unit 608
- 4200 W 800 N
- 82 N 2875 W
- 3971 W 975 S
- 114 N 2825 W
Your Personal Tour Guide
Ask me questions while you tour the home.