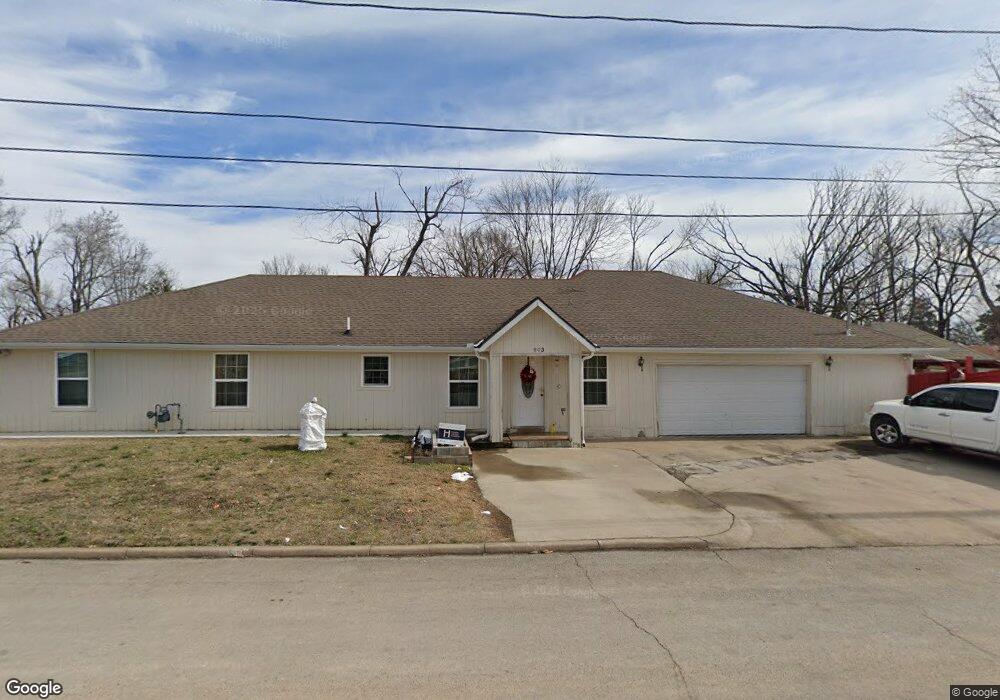
903 S 3rd St Rogers, AR 72756
Estimated Value: $442,512 - $525,000
Studio
2
Baths
2,522
Sq Ft
$192/Sq Ft
Est. Value
About This Home
This home is located at 903 S 3rd St, Rogers, AR 72756 and is currently estimated at $483,378, approximately $191 per square foot. 903 S 3rd St is a home located in Benton County with nearby schools including Frank Tillery Elementary School, Lingle Middle School, and Rogers Heritage High School.
Ownership History
Date
Name
Owned For
Owner Type
Purchase Details
Closed on
Jun 23, 2011
Sold by
Almaraz J Jesus
Bought by
Almaraz J Jesus and Almaraz Jose R
Current Estimated Value
Purchase Details
Closed on
Mar 8, 1996
Bought by
Almarez
Purchase Details
Closed on
Jun 6, 1995
Bought by
Henry G
Purchase Details
Closed on
Sep 10, 1991
Bought by
Henry
Purchase Details
Closed on
Aug 21, 1991
Bought by
Patton
Purchase Details
Closed on
May 18, 1983
Bought by
Patton
Purchase Details
Closed on
Aug 18, 1980
Bought by
Connoly
Create a Home Valuation Report for This Property
The Home Valuation Report is an in-depth analysis detailing your home's value as well as a comparison with similar homes in the area
Home Values in the Area
Average Home Value in this Area
Purchase History
| Date | Buyer | Sale Price | Title Company |
|---|---|---|---|
| Almaraz J Jesus | -- | None Available | |
| Almarez | -- | -- | |
| Henry G | -- | -- | |
| Henry | $22,000 | -- | |
| Patton | -- | -- | |
| Patton | -- | -- | |
| Connoly | $22,000 | -- |
Source: Public Records
Tax History
| Year | Tax Paid | Tax Assessment Tax Assessment Total Assessment is a certain percentage of the fair market value that is determined by local assessors to be the total taxable value of land and additions on the property. | Land | Improvement |
|---|---|---|---|---|
| 2025 | $1,506 | $69,965 | $19,000 | $50,965 |
| 2024 | $1,470 | $69,965 | $19,000 | $50,965 |
| 2023 | $1,470 | $47,390 | $8,000 | $39,390 |
| 2022 | $1,153 | $47,390 | $8,000 | $39,390 |
| 2021 | $1,149 | $47,390 | $8,000 | $39,390 |
| 2020 | $1,150 | $27,780 | $2,400 | $25,380 |
| 2019 | $1,150 | $27,780 | $2,400 | $25,380 |
| 2018 | $1,175 | $27,780 | $2,400 | $25,380 |
| 2017 | $1,092 | $27,780 | $2,400 | $25,380 |
| 2016 | $1,092 | $27,780 | $2,400 | $25,380 |
| 2015 | $1,874 | $35,420 | $3,400 | $32,020 |
| 2014 | $1,524 | $35,420 | $3,400 | $32,020 |
Source: Public Records
Map
Nearby Homes
- Lot 7 S 3rd St
- Lot 5 S 3rd St
- Lot 6 S 3rd St
- 217 W Birch St
- 803 S 1st St
- 401 W Mulberry St
- 1203 S 3rd St
- 1013 S 1st St
- 525 S 6th St
- 707 S 7th St
- 1023 S B St
- 501 S 7th St
- 1419 S Arkansas St
- 1511 S 5th St Unit 2
- 630 W Poplar St
- 906 W Holly St
- 0 E Spring St
- 1014 S E St
- 511 Spring St
- 1.47 Acres E Allen St
Your Personal Tour Guide
Ask me questions while you tour the home.