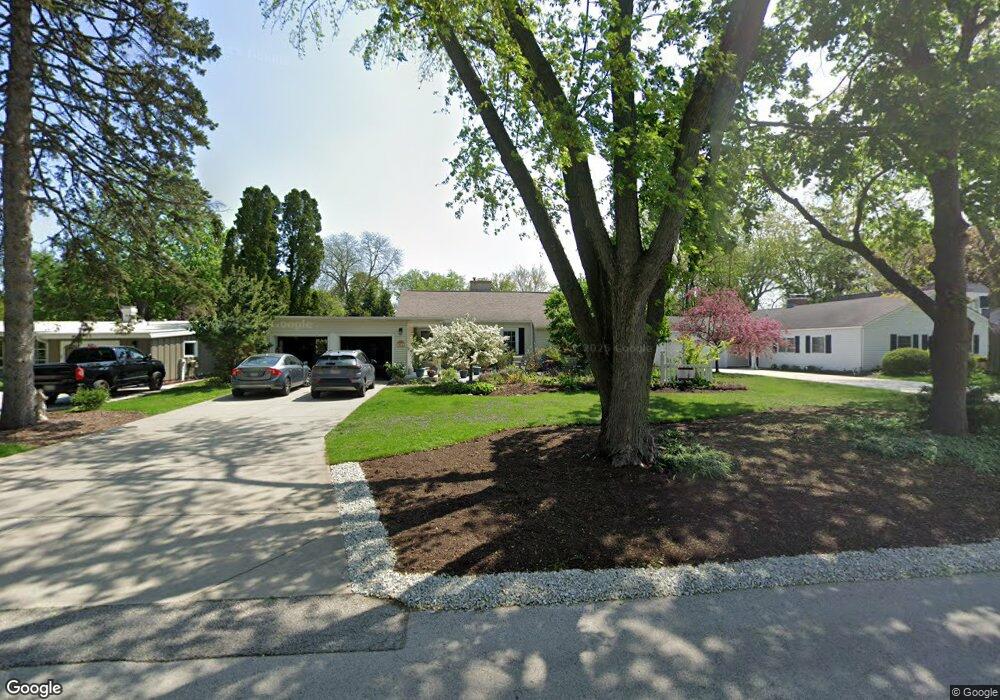
903 S Main St Wheaton, IL 60189
Southeast Wheaton NeighborhoodEstimated Value: $421,289 - $526,000
3
Beds
2
Baths
1,462
Sq Ft
$328/Sq Ft
Est. Value
About This Home
This home is located at 903 S Main St, Wheaton, IL 60189 and is currently estimated at $479,072, approximately $327 per square foot. 903 S Main St is a home located in DuPage County with nearby schools including Whittier Elementary School, Edison Middle School, and Wheaton Warrenville South High School.
Ownership History
Date
Name
Owned For
Owner Type
Purchase Details
Closed on
Oct 5, 2010
Sold by
Mackey William P and Mackey Christine L
Bought by
Mackey William P and Mackey Christine L
Current Estimated Value
Purchase Details
Closed on
Jul 10, 2002
Sold by
Price Beryl W and Price Frances A
Bought by
Mackey William P and Mackey Christine L
Home Financials for this Owner
Home Financials are based on the most recent Mortgage that was taken out on this home.
Original Mortgage
$219,200
Outstanding Balance
$93,516
Interest Rate
6.8%
Estimated Equity
$385,556
Create a Home Valuation Report for This Property
The Home Valuation Report is an in-depth analysis detailing your home's value as well as a comparison with similar homes in the area
Home Values in the Area
Average Home Value in this Area
Purchase History
| Date | Buyer | Sale Price | Title Company |
|---|---|---|---|
| Mackey William P | -- | None Available | |
| Mackey William P | $274,000 | First American Title |
Source: Public Records
Mortgage History
| Date | Status | Borrower | Loan Amount |
|---|---|---|---|
| Open | Mackey William P | $219,200 | |
| Closed | Mackey William P | $41,000 |
Source: Public Records
Tax History
| Year | Tax Paid | Tax Assessment Tax Assessment Total Assessment is a certain percentage of the fair market value that is determined by local assessors to be the total taxable value of land and additions on the property. | Land | Improvement |
|---|---|---|---|---|
| 2024 | $8,428 | $142,796 | $36,970 | $105,826 |
| 2023 | $8,091 | $131,440 | $34,030 | $97,410 |
| 2022 | $7,944 | $120,710 | $32,160 | $88,550 |
| 2021 | $7,916 | $117,850 | $31,400 | $86,450 |
| 2020 | $7,891 | $116,750 | $31,110 | $85,640 |
| 2019 | $7,708 | $113,670 | $30,290 | $83,380 |
| 2018 | $7,306 | $106,870 | $28,540 | $78,330 |
| 2017 | $7,194 | $102,930 | $27,490 | $75,440 |
| 2016 | $7,095 | $98,820 | $26,390 | $72,430 |
| 2015 | $7,036 | $94,280 | $25,180 | $69,100 |
| 2014 | $7,082 | $93,340 | $24,760 | $68,580 |
| 2013 | $6,900 | $93,620 | $24,830 | $68,790 |
Source: Public Records
Map
Nearby Homes
- 909 S Wheaton Ave
- 715 S Naperville Rd
- 921 James Ct
- 1318 Gamon Rd
- 520 S Wheaton Ave
- 522 S West St
- 536 W Evergreen St
- 110 E Farnham Ln
- 421 E Willow Ave
- 1219 Golf Ln
- 1526 Gainesboro Dr
- 1S538 Bayberry Ln
- 1021 Greenwood Dr
- 100 N Gary Ave Unit 408
- 1542 Castlewood Dr
- 510 S President St
- 1028 Lodalia Ct
- 1026 Briarcliffe Blvd
- 606 W Franklin St
- 314 E Jefferson Ave
Your Personal Tour Guide
Ask me questions while you tour the home.