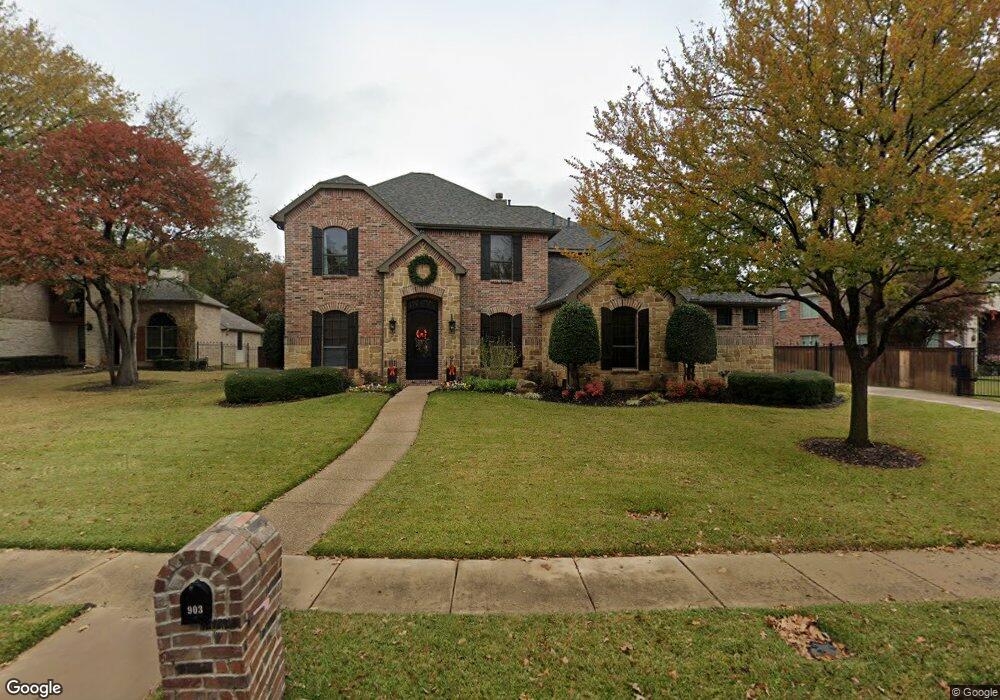
903 Siena Dr Southlake, TX 76092
Estimated Value: $826,971 - $1,117,000
3
Beds
2
Baths
3,596
Sq Ft
$281/Sq Ft
Est. Value
About This Home
This home is located at 903 Siena Dr, Southlake, TX 76092 and is currently estimated at $1,009,743, approximately $280 per square foot. 903 Siena Dr is a home located in Tarrant County with nearby schools including Florence Elementary School, Bear Creek Intermediate School, and Keller Middle School.
Ownership History
Date
Name
Owned For
Owner Type
Purchase Details
Closed on
Aug 30, 2004
Sold by
Ashton Dallas Residential Llc
Bought by
Thomas Tommy G and Jill Thomas L
Current Estimated Value
Home Financials for this Owner
Home Financials are based on the most recent Mortgage that was taken out on this home.
Original Mortgage
$327,200
Outstanding Balance
$161,963
Interest Rate
6.08%
Mortgage Type
Purchase Money Mortgage
Estimated Equity
$847,780
Create a Home Valuation Report for This Property
The Home Valuation Report is an in-depth analysis detailing your home's value as well as a comparison with similar homes in the area
Home Values in the Area
Average Home Value in this Area
Purchase History
| Date | Buyer | Sale Price | Title Company |
|---|---|---|---|
| Thomas Tommy G | -- | Stewart Title |
Source: Public Records
Mortgage History
| Date | Status | Borrower | Loan Amount |
|---|---|---|---|
| Open | Thomas Tommy G | $327,200 | |
| Closed | Thomas Tommy G | $61,373 |
Source: Public Records
Tax History Compared to Growth
Tax History
| Year | Tax Paid | Tax Assessment Tax Assessment Total Assessment is a certain percentage of the fair market value that is determined by local assessors to be the total taxable value of land and additions on the property. | Land | Improvement |
|---|---|---|---|---|
| 2025 | $9,552 | $559,488 | $203,702 | $355,786 |
| 2024 | $9,552 | $659,307 | $203,702 | $455,605 |
| 2023 | $8,959 | $631,589 | $203,702 | $427,887 |
| 2022 | $11,197 | $506,291 | $143,790 | $362,501 |
| 2021 | $12,340 | $516,700 | $143,790 | $372,910 |
| 2020 | $12,545 | $521,227 | $143,790 | $377,437 |
| 2019 | $12,658 | $521,228 | $143,790 | $377,438 |
| 2018 | $10,727 | $451,000 | $55,120 | $395,880 |
| 2017 | $10,695 | $410,000 | $55,120 | $354,880 |
| 2016 | $10,800 | $414,000 | $55,120 | $358,880 |
| 2015 | $9,555 | $376,800 | $70,000 | $306,800 |
| 2014 | $9,555 | $376,800 | $70,000 | $306,800 |
Source: Public Records
Map
Nearby Homes
- 2616 Park Grove Loop
- 2620 Park Grove Loop
- 2401 Lower Brook Ct
- 1005 Siena Dr
- 365 Watermere Dr
- 2636 Park Grove Loop
- 2525 Park Grove Loop
- 301 Watermere Dr Unit 401
- 301 Watermere Dr Unit 317
- 301 Watermere Dr Unit 216
- 351 Watermere Dr
- 503 Sorenson Trail
- 112 Stony Brook Way
- 2499 Union Church Rd
- 2728 Edgebrook Ct
- 3004 Veranda Ln
- 929 Winding Ridge Trail
- 528 Sorenson Trail
- 602 Signet Ct
- 2608 W Southlake Blvd
- 901 Siena Dr
- 905 Siena Dr
- 722 Portofino Place
- 705 Venice Ave
- 906 Siena Dr
- 804 Venice Ave
- 720 Portofino Place
- 701 Venice Ave
- 800 Venice Ave
- 801 Portofino Place
- 805 Portofino Place
- 900 Venice Ave
- 721 Portofino Place
- 910 Siena Dr
- 704 Venice Ave
- 904 Venice Ave
- 1001 Venice Ave
- 719 Portofino Place
- 913 Siena Dr
- 700 Venice Ave