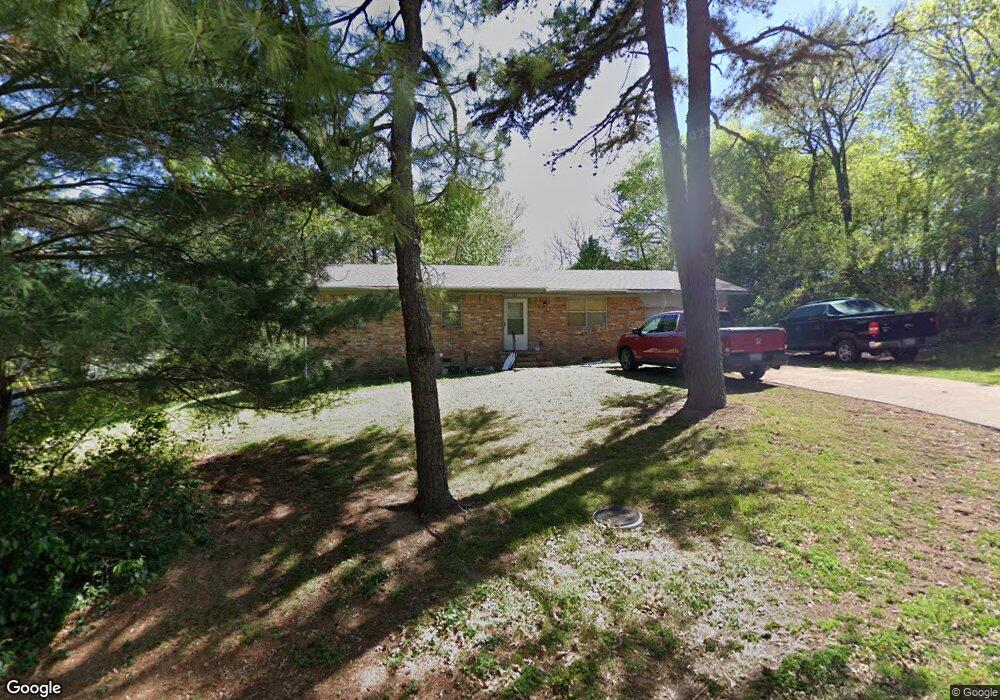
903 Sleepy St Tahlequah, OK 74464
Estimated Value: $121,202 - $181,000
3
Beds
2
Baths
1,056
Sq Ft
$144/Sq Ft
Est. Value
About This Home
This home is located at 903 Sleepy St, Tahlequah, OK 74464 and is currently estimated at $152,551, approximately $144 per square foot. 903 Sleepy St is a home located in Cherokee County with nearby schools including Grand View Public School, Agape Christian Academy, and Shiloh Christian School.
Ownership History
Date
Name
Owned For
Owner Type
Purchase Details
Closed on
Nov 16, 2009
Sold by
Simmons Thomas and Miller Dawn
Bought by
Boney Roy
Current Estimated Value
Home Financials for this Owner
Home Financials are based on the most recent Mortgage that was taken out on this home.
Original Mortgage
$89,285
Outstanding Balance
$57,764
Interest Rate
4.9%
Mortgage Type
New Conventional
Estimated Equity
$94,787
Purchase Details
Closed on
Oct 30, 2009
Sold by
Simmons Thomas and Miller Dawn
Bought by
Boney Roy
Home Financials for this Owner
Home Financials are based on the most recent Mortgage that was taken out on this home.
Original Mortgage
$89,285
Outstanding Balance
$57,764
Interest Rate
4.9%
Mortgage Type
New Conventional
Estimated Equity
$94,787
Purchase Details
Closed on
Apr 11, 2007
Sold by
Wilmon Michael W and Wilmon Phyllis R
Bought by
Simmons Thomas and Simmons Laume
Create a Home Valuation Report for This Property
The Home Valuation Report is an in-depth analysis detailing your home's value as well as a comparison with similar homes in the area
Home Values in the Area
Average Home Value in this Area
Purchase History
| Date | Buyer | Sale Price | Title Company |
|---|---|---|---|
| Boney Roy | -- | None Available | |
| Boney Roy | -- | None Available | |
| Simmons Thomas | $75,000 | Tahlequah Abstract Closing S |
Source: Public Records
Mortgage History
| Date | Status | Borrower | Loan Amount |
|---|---|---|---|
| Open | Boney Roy | $89,285 |
Source: Public Records
Tax History Compared to Growth
Tax History
| Year | Tax Paid | Tax Assessment Tax Assessment Total Assessment is a certain percentage of the fair market value that is determined by local assessors to be the total taxable value of land and additions on the property. | Land | Improvement |
|---|---|---|---|---|
| 2025 | $689 | $8,709 | $1,546 | $7,163 |
| 2024 | $689 | $8,294 | $880 | $7,414 |
| 2023 | $689 | $8,282 | $880 | $7,402 |
| 2022 | $588 | $8,282 | $880 | $7,402 |
| 2021 | $588 | $8,282 | $880 | $7,402 |
| 2020 | $588 | $8,282 | $880 | $7,402 |
| 2019 | $642 | $8,282 | $880 | $7,402 |
| 2018 | $664 | $8,501 | $880 | $7,621 |
| 2017 | $668 | $8,501 | $880 | $7,621 |
| 2016 | $654 | $8,270 | $880 | $7,390 |
| 2015 | $618 | $7,876 | $880 | $6,996 |
| 2014 | $711 | $9,020 | $880 | $8,140 |
Source: Public Records
Map
Nearby Homes
- 780 W Southlake Dr
- 1471 N Angus Ave
- 511 W Allen Rd
- 1998 W Allen Rd
- 3063 Mountain
- 1032 Watercolor
- 1189 Watercolor
- 15300 N Jarvis
- 947 Seagrove
- 932 Watercolor
- 978 Seagrove
- 1281 Watercolor
- 15350 Hwy 62
- 907 Watercolor
- 961 Watercolor
- 3058 Mountain
- 1242 Watercolor
- 1221 Watercolor
- 1074 Watercolor
- 850 Grayton
- 904 Sheryl St
- 901 Sleepy St
- 904 Sleepy St
- 912 Sheryl St
- 1501 Clayton Dr
- 908 Sleepy St
- 1601 Clayton Dr
- 1602 N Sleepy Hollow Ln
- 0 Clayton Dr
- 903 Sheryl St
- 907 Sheryl St
- 1615 Clayton Dr
- 1506 Clayton Dr
- 1611 Clayton Dr
- 1619 Clayton Dr
- 1602 Clayton Dr
- 1502 Clayton Dr
- 1406 N Sleepy Hollow Ln
- 1606 Clayton Dr
- 1606 N Sleepy Hollow Ln