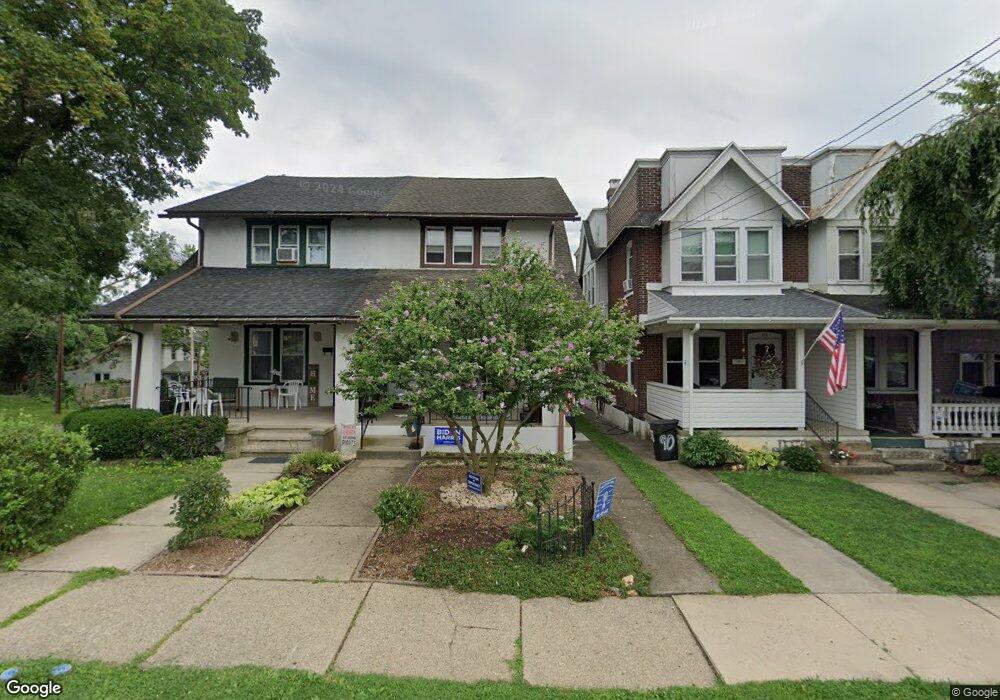
903 Spring St Bethlehem, PA 18018
West Bethlehem NeighborhoodEstimated Value: $251,000 - $292,000
3
Beds
2
Baths
1,358
Sq Ft
$196/Sq Ft
Est. Value
About This Home
This home is located at 903 Spring St, Bethlehem, PA 18018 and is currently estimated at $265,755, approximately $195 per square foot. 903 Spring St is a home located in Lehigh County with nearby schools including Calypso Elementary School, Nitschmann Middle School, and Liberty High School.
Ownership History
Date
Name
Owned For
Owner Type
Purchase Details
Closed on
Nov 16, 2007
Sold by
Bond Christopher A
Bought by
Condon Debra
Current Estimated Value
Home Financials for this Owner
Home Financials are based on the most recent Mortgage that was taken out on this home.
Original Mortgage
$130,500
Outstanding Balance
$82,739
Interest Rate
6.42%
Mortgage Type
New Conventional
Estimated Equity
$183,016
Purchase Details
Closed on
Mar 20, 1996
Sold by
Dotter Clinton and Dotter Loana
Bought by
Bond Christopher A
Create a Home Valuation Report for This Property
The Home Valuation Report is an in-depth analysis detailing your home's value as well as a comparison with similar homes in the area
Home Values in the Area
Average Home Value in this Area
Purchase History
| Date | Buyer | Sale Price | Title Company |
|---|---|---|---|
| Condon Debra | $145,000 | -- | |
| Bond Christopher A | $69,900 | -- |
Source: Public Records
Mortgage History
| Date | Status | Borrower | Loan Amount |
|---|---|---|---|
| Open | Condon Debra | $130,500 |
Source: Public Records
Tax History
| Year | Tax Paid | Tax Assessment Tax Assessment Total Assessment is a certain percentage of the fair market value that is determined by local assessors to be the total taxable value of land and additions on the property. | Land | Improvement |
|---|---|---|---|---|
| 2025 | $3,192 | $111,100 | $11,500 | $99,600 |
| 2024 | $3,155 | $111,100 | $11,500 | $99,600 |
| 2023 | $3,127 | $111,100 | $11,500 | $99,600 |
| 2022 | $3,179 | $111,100 | $99,600 | $11,500 |
| 2021 | $3,164 | $111,100 | $11,500 | $99,600 |
| 2020 | $3,063 | $111,100 | $11,500 | $99,600 |
| 2019 | $3,085 | $111,100 | $11,500 | $99,600 |
| 2018 | $3,025 | $111,100 | $11,500 | $99,600 |
| 2017 | $2,891 | $111,100 | $11,500 | $99,600 |
| 2016 | -- | $111,100 | $11,500 | $99,600 |
| 2015 | -- | $111,100 | $11,500 | $99,600 |
| 2014 | -- | $111,100 | $11,500 | $99,600 |
Source: Public Records
Map
Nearby Homes
Your Personal Tour Guide
Ask me questions while you tour the home.