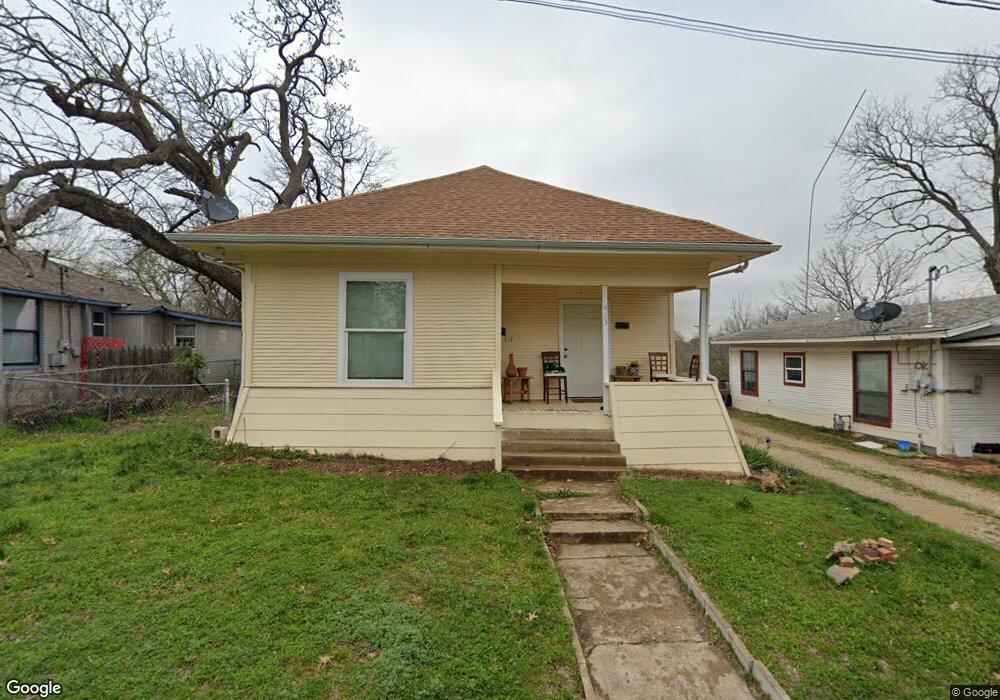
903 W Laurel St Sherman, TX 75092
Estimated Value: $110,734 - $162,000
--
Bed
--
Bath
656
Sq Ft
$208/Sq Ft
Est. Value
About This Home
This home is located at 903 W Laurel St, Sherman, TX 75092 and is currently estimated at $136,367, approximately $207 per square foot. 903 W Laurel St is a home located in Grayson County with nearby schools including Wakefield Elementary School, Piner Middle School, and Dillingham Intermediate School.
Ownership History
Date
Name
Owned For
Owner Type
Purchase Details
Closed on
May 25, 2018
Sold by
Tunnell Freddie and Tunnell Ann
Bought by
Cabrera Juan Carlos
Current Estimated Value
Purchase Details
Closed on
Nov 30, 2007
Sold by
Gilberti Albert
Bought by
Tunnell Freddie and Tunnell Ann
Purchase Details
Closed on
Oct 6, 2005
Sold by
Harris Leon
Bought by
Gilberti Albert
Home Financials for this Owner
Home Financials are based on the most recent Mortgage that was taken out on this home.
Original Mortgage
$22,650
Interest Rate
5.65%
Mortgage Type
Seller Take Back
Purchase Details
Closed on
Oct 4, 2005
Sold by
Stegman Bobby and Stegman Wendy
Bought by
Harris Leon
Home Financials for this Owner
Home Financials are based on the most recent Mortgage that was taken out on this home.
Original Mortgage
$22,650
Interest Rate
5.65%
Mortgage Type
Seller Take Back
Purchase Details
Closed on
Dec 1, 2003
Sold by
Harris Leon
Bought by
Stegman Bobby and Stegman Wendy
Create a Home Valuation Report for This Property
The Home Valuation Report is an in-depth analysis detailing your home's value as well as a comparison with similar homes in the area
Home Values in the Area
Average Home Value in this Area
Purchase History
| Date | Buyer | Sale Price | Title Company |
|---|---|---|---|
| Cabrera Juan Carlos | -- | None Available | |
| Tunnell Freddie | -- | Sherman Title | |
| Gilberti Albert | -- | -- | |
| Harris Leon | $28,272 | -- | |
| Stegman Bobby | -- | -- |
Source: Public Records
Mortgage History
| Date | Status | Borrower | Loan Amount |
|---|---|---|---|
| Previous Owner | Gilberti Albert | $22,650 | |
| Closed | Stegman Bobby | $0 |
Source: Public Records
Tax History Compared to Growth
Tax History
| Year | Tax Paid | Tax Assessment Tax Assessment Total Assessment is a certain percentage of the fair market value that is determined by local assessors to be the total taxable value of land and additions on the property. | Land | Improvement |
|---|---|---|---|---|
| 2025 | $751 | $83,042 | $44,774 | $38,268 |
| 2024 | $1,834 | $83,614 | $44,774 | $38,840 |
| 2023 | $805 | $89,688 | $37,393 | $52,295 |
| 2022 | $1,996 | $85,146 | $37,576 | $47,570 |
| 2021 | $1,951 | $77,847 | $35,929 | $41,918 |
| 2020 | $1,571 | $59,873 | $17,507 | $42,366 |
| 2019 | $865 | $32,103 | $8,845 | $23,258 |
| 2018 | $585 | $23,323 | $5,978 | $17,345 |
| 2017 | $535 | $21,482 | $5,978 | $15,504 |
| 2016 | $461 | $18,523 | $5,978 | $12,545 |
| 2015 | $489 | $19,689 | $5,978 | $13,711 |
| 2014 | $476 | $19,162 | $5,978 | $13,184 |
Source: Public Records
Map
Nearby Homes
- 225 N Binkley St
- 827 W Ellis St
- 511 N Ricketts St
- 545 N Wharton St
- 116 S Bryant Ave
- 603 N Wharton St
- 318 N Mckown Ave
- 721 W Washington St
- 616 Kessler Blvd
- 653 Kessler Blvd
- 920 W Brockett St
- 320 W Washington St
- 716 Kessler Blvd
- 318 W Laurel St
- 820 W College St
- 902 N Woods St
- 1407 Robin Dr
- 606 S Gordon St
- 1420 W Shields Dr
- 0000 Hwy 75
- 905 W Laurel St
- 901 W Laurel St
- 214 N Ricketts St
- 917 W Laurel St
- 120 N Ricketts St
- 216 N Ricketts St
- 831 W Laurel St
- 908 W Laurel St
- 921 W Laurel St
- 912 W Laurel St Unit 916
- 211 N Ricketts St
- 215 N Ricketts St N
- 116 N Ricketts St
- 215 N Ricketts St
- 215 N Rickets
- 222 N Ricketts St
- 121 N Ricketts St
- 121 N Ricketts St Unit N & S
- 913 W Laurel St Unit A
- 823 W Laurel St