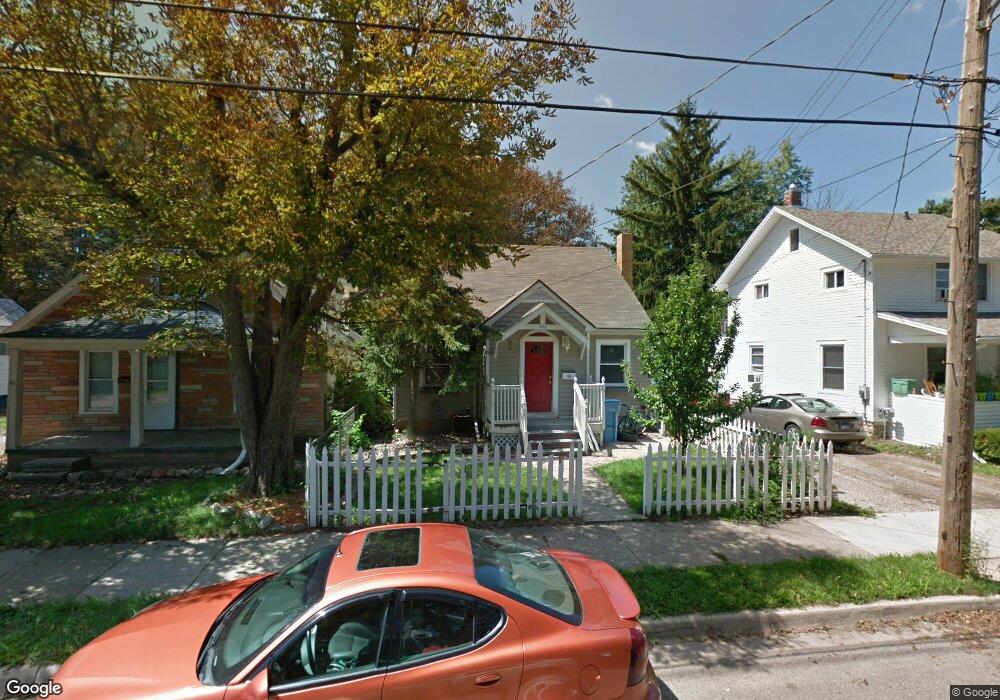
903 Westmoreland Ave Lansing, MI 48915
Hull Court Park NeighborhoodEstimated Value: $100,039 - $127,000
--
Bed
--
Bath
890
Sq Ft
$124/Sq Ft
Est. Value
About This Home
This home is located at 903 Westmoreland Ave, Lansing, MI 48915 and is currently estimated at $110,510, approximately $124 per square foot. 903 Westmoreland Ave is a home located in Ingham County with nearby schools including Riddle Elementary School, Pattengill Academy, and J.W. Sexton High School.
Ownership History
Date
Name
Owned For
Owner Type
Purchase Details
Closed on
May 16, 2011
Sold by
Everest 2
Bought by
Gooch Richard
Current Estimated Value
Purchase Details
Closed on
Feb 3, 2011
Sold by
Gooch Richard and Gooch Autumn
Bought by
Wolverine Bank
Purchase Details
Closed on
Jan 24, 2008
Sold by
Davis Brent and Davis Jennifer
Bought by
Citimortgage Inc
Purchase Details
Closed on
Jun 26, 2000
Sold by
Bennett Patricia
Bought by
Davis Brent
Home Financials for this Owner
Home Financials are based on the most recent Mortgage that was taken out on this home.
Original Mortgage
$71,907
Interest Rate
8.64%
Mortgage Type
FHA
Purchase Details
Closed on
Sep 15, 1998
Bought by
Bennett Patricia
Create a Home Valuation Report for This Property
The Home Valuation Report is an in-depth analysis detailing your home's value as well as a comparison with similar homes in the area
Home Values in the Area
Average Home Value in this Area
Purchase History
| Date | Buyer | Sale Price | Title Company |
|---|---|---|---|
| Gooch Richard | -- | None Available | |
| Wolverine Bank | $240,800 | None Available | |
| Citimortgage Inc | $60,100 | None Available | |
| Davis Brent | $72,500 | First American Title Ins Co | |
| Bennett Patricia | $59,900 | -- |
Source: Public Records
Mortgage History
| Date | Status | Borrower | Loan Amount |
|---|---|---|---|
| Previous Owner | Davis Brent | $71,907 |
Source: Public Records
Tax History Compared to Growth
Tax History
| Year | Tax Paid | Tax Assessment Tax Assessment Total Assessment is a certain percentage of the fair market value that is determined by local assessors to be the total taxable value of land and additions on the property. | Land | Improvement |
|---|---|---|---|---|
| 2025 | $2,500 | $43,300 | $4,800 | $38,500 |
| 2024 | $21 | $42,800 | $4,800 | $38,000 |
| 2023 | $2,285 | $37,300 | $4,800 | $32,500 |
| 2022 | $2,088 | $31,600 | $4,500 | $27,100 |
| 2021 | $2,040 | $29,000 | $3,800 | $25,200 |
| 2020 | $2,060 | $25,900 | $3,800 | $22,100 |
| 2019 | $1,955 | $24,200 | $3,800 | $20,400 |
| 2018 | $1,849 | $23,900 | $3,800 | $20,100 |
| 2017 | $1,855 | $23,900 | $3,800 | $20,100 |
| 2016 | $1,746 | $23,400 | $3,800 | $19,600 |
| 2015 | $1,746 | $22,800 | $7,542 | $15,258 |
| 2014 | $1,746 | $23,100 | $12,000 | $11,100 |
Source: Public Records
Map
Nearby Homes
- 819 N Jenison Ave
- 751 Westmoreland Ave
- 1310 W Maple St
- 1300 W Maple St
- 908 Clyde St
- 1016 Cleo St
- 1229 W Saginaw St
- 1225 W Saginaw St
- 1221 W Saginaw St
- 1217 W Saginaw St
- 821 N Verlinden Ave
- 814 N Martin Luther King jr Blvd
- 1019 Daleford St
- 910 Durant St
- 1840 W Maple St
- 1224 Theodore St
- 518 N Jenison Ave
- 1129 N Martin Luther King jr Blvd
- 914 Stanley St
- 1145 N Martin Luther King Junior Blvd
- 907 Westmoreland Ave
- 829 Westmoreland Ave
- 823 Westmoreland Ave
- 911 Westmoreland Ave
- 906 N Jeniso
- 915 Westmoreland Ave
- 821 Westmoreland Ave
- 906 N Jenison Ave
- 902 N Jenison Ave
- 910 N Jenison Ave
- 824 N Jenison Ave
- 912 N Jenison Ave
- 815 Westmoreland Ave
- 902 Westmoreland Ave
- 914 N Jenison Ave
- 906 Westmoreland Ave
- 822 Westmoreland Ave
- 910 Westmoreland Ave
- 921 Westmoreland Ave