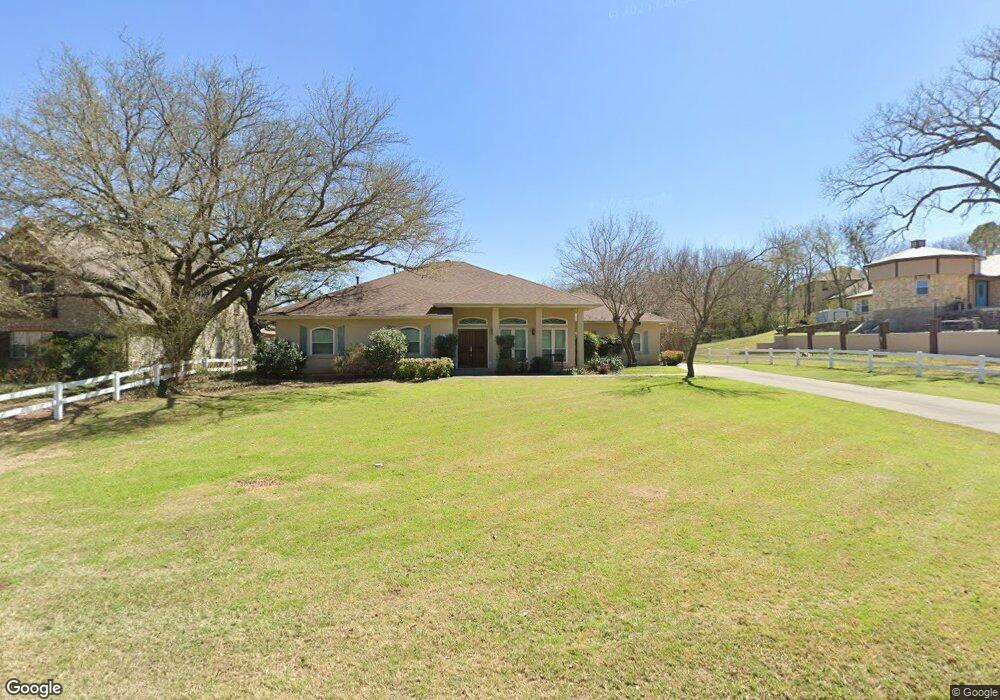
903 Willowcreek Rd Cleburne, TX 76033
Estimated Value: $383,967 - $429,000
3
Beds
3
Baths
2,128
Sq Ft
$187/Sq Ft
Est. Value
About This Home
This home is located at 903 Willowcreek Rd, Cleburne, TX 76033 and is currently estimated at $397,242, approximately $186 per square foot. 903 Willowcreek Rd is a home located in Johnson County with nearby schools including Coleman Elementary School, Lowell Smith Jr. Middle School, and Cleburne High School.
Ownership History
Date
Name
Owned For
Owner Type
Purchase Details
Closed on
Jul 29, 2016
Sold by
Bowen Delbert and Bowen Leonard Delbert
Bought by
Cooper Joan M
Current Estimated Value
Home Financials for this Owner
Home Financials are based on the most recent Mortgage that was taken out on this home.
Original Mortgage
$156,000
Outstanding Balance
$124,710
Interest Rate
3.54%
Mortgage Type
New Conventional
Estimated Equity
$272,532
Purchase Details
Closed on
Jun 28, 2016
Sold by
Stamps Gerrt Wayne
Bought by
Bowen Delbert
Home Financials for this Owner
Home Financials are based on the most recent Mortgage that was taken out on this home.
Original Mortgage
$156,000
Outstanding Balance
$124,710
Interest Rate
3.54%
Mortgage Type
New Conventional
Estimated Equity
$272,532
Create a Home Valuation Report for This Property
The Home Valuation Report is an in-depth analysis detailing your home's value as well as a comparison with similar homes in the area
Home Values in the Area
Average Home Value in this Area
Purchase History
| Date | Buyer | Sale Price | Title Company |
|---|---|---|---|
| Cooper Joan M | -- | None Available | |
| Bowen Delbert | -- | None Available |
Source: Public Records
Mortgage History
| Date | Status | Borrower | Loan Amount |
|---|---|---|---|
| Open | Cooper Joan M | $156,000 |
Source: Public Records
Tax History Compared to Growth
Tax History
| Year | Tax Paid | Tax Assessment Tax Assessment Total Assessment is a certain percentage of the fair market value that is determined by local assessors to be the total taxable value of land and additions on the property. | Land | Improvement |
|---|---|---|---|---|
| 2025 | $3,221 | $363,098 | $65,000 | $298,098 |
| 2024 | $6,462 | $289,824 | $0 | $0 |
| 2023 | $3,082 | $363,098 | $65,000 | $298,098 |
| 2022 | $5,994 | $267,309 | $55,000 | $212,309 |
| 2021 | $5,681 | $217,749 | $50,000 | $167,749 |
| 2020 | $5,618 | $202,749 | $35,000 | $167,749 |
| 2019 | $5,490 | $185,785 | $35,000 | $150,785 |
| 2018 | $5,492 | $185,785 | $35,000 | $150,785 |
| 2017 | $6,113 | $207,671 | $35,000 | $172,671 |
| 2016 | $6,113 | $207,671 | $35,000 | $172,671 |
| 2015 | $2,334 | $207,671 | $35,000 | $172,671 |
| 2014 | $2,334 | $207,671 | $35,000 | $172,671 |
Source: Public Records
Map
Nearby Homes
- 4112 Highland Dr
- 4101 Highland Dr
- 909 Highland Dr
- 616 Bellevue Dr
- 311 Sunset Dr
- 1103 Trace Rd
- 714 Forrest Ave
- 1115 Green River Trail
- 1107 Stanwood Ave
- 215 Sunset Dr
- 1104 Cherrywood Dr
- 1116 Willowcreek Rd
- 611 Forrest Ave
- 840 S Ridgeway Dr
- 1503 Stanwood Ave
- 404 Forrest Ave
- 1104 Lynnwood Dr
- 1208 Cindy Ln
- 1204 W Westhill Dr
- 1211 Greenbriar Ln
- 901 Willowcreek Rd
- 935 Highland Dr
- 933 Highland Dr
- 819 Shady Creek Dr
- 931 Highland Dr
- 1001 Willowcreek Rd
- 1000 Willowcreek Rd
- 930 Highland Dr
- 928 Highland Dr
- 818 Shady Creek Dr
- 1002 Willowcreek Rd
- 1003 Willowcreek Rd
- 929 Highland Dr
- 817 Shady Creek Dr
- 903 Willowcreek Ct
- 926 Highland Dr
- 1004 Willowcreek Rd
- 816 Shady Creek Dr
- 905 Willowcreek Ct
- 602 Sunset Dr