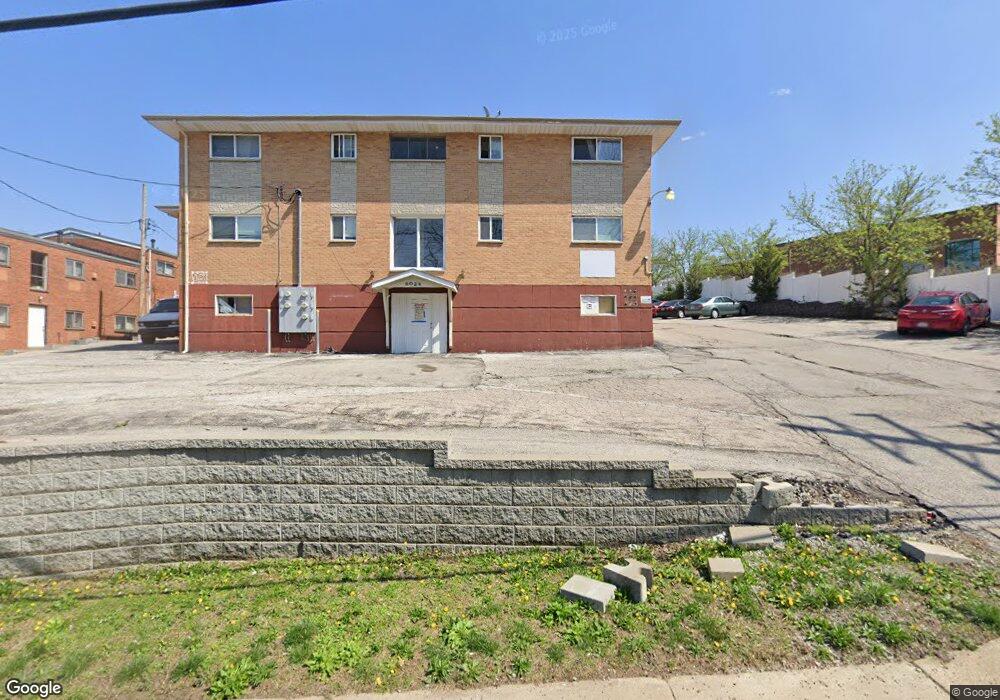
9030 S Laclede Station Rd Unit 1S Saint Louis, MO 63123
Estimated Value: $76,000 - $150,000
2
Beds
1
Bath
841
Sq Ft
$146/Sq Ft
Est. Value
About This Home
This home is located at 9030 S Laclede Station Rd Unit 1S, Saint Louis, MO 63123 and is currently estimated at $122,740, approximately $145 per square foot. 9030 S Laclede Station Rd Unit 1S is a home located in St. Louis County with nearby schools including Truman Middle School, Lindbergh High School, and Holy Cross Academy.
Ownership History
Date
Name
Owned For
Owner Type
Purchase Details
Closed on
Sep 13, 2013
Sold by
Federal Home Loan Mortgage Corporation
Bought by
Zafer Ahmad Farid
Current Estimated Value
Purchase Details
Closed on
Feb 5, 2013
Sold by
Forester John Robert
Bought by
Federal Home Loan Mortgage Corporation
Purchase Details
Closed on
Sep 6, 2005
Sold by
Sanders Melissa V
Bought by
Forester John Robert
Home Financials for this Owner
Home Financials are based on the most recent Mortgage that was taken out on this home.
Original Mortgage
$94,500
Interest Rate
5.88%
Mortgage Type
Fannie Mae Freddie Mac
Purchase Details
Closed on
Feb 27, 2004
Sold by
Bain Charles E
Bought by
Sanders Melissa
Home Financials for this Owner
Home Financials are based on the most recent Mortgage that was taken out on this home.
Original Mortgage
$71,100
Interest Rate
5.68%
Mortgage Type
Purchase Money Mortgage
Create a Home Valuation Report for This Property
The Home Valuation Report is an in-depth analysis detailing your home's value as well as a comparison with similar homes in the area
Home Values in the Area
Average Home Value in this Area
Purchase History
| Date | Buyer | Sale Price | Title Company |
|---|---|---|---|
| Zafer Ahmad Farid | $30,000 | Continental Title Company | |
| Federal Home Loan Mortgage Corporation | $65,000 | None Available | |
| Forester John Robert | $94,500 | -- | |
| Sanders Melissa | -- | -- |
Source: Public Records
Mortgage History
| Date | Status | Borrower | Loan Amount |
|---|---|---|---|
| Previous Owner | Forester John Robert | $94,500 | |
| Previous Owner | Sanders Melissa | $71,100 |
Source: Public Records
Tax History Compared to Growth
Tax History
| Year | Tax Paid | Tax Assessment Tax Assessment Total Assessment is a certain percentage of the fair market value that is determined by local assessors to be the total taxable value of land and additions on the property. | Land | Improvement |
|---|---|---|---|---|
| 2025 | $1,275 | $20,010 | $4,390 | $15,620 |
| 2024 | $1,275 | $18,070 | $2,870 | $15,200 |
| 2023 | $1,256 | $18,070 | $2,870 | $15,200 |
| 2022 | $1,194 | $15,280 | $4,390 | $10,890 |
| 2021 | $1,083 | $15,280 | $4,390 | $10,890 |
| 2020 | $1,011 | $13,610 | $2,870 | $10,740 |
| 2019 | $1,009 | $13,610 | $2,870 | $10,740 |
| 2018 | $890 | $10,830 | $1,840 | $8,990 |
| 2017 | $876 | $10,830 | $1,840 | $8,990 |
| 2016 | $928 | $11,250 | $2,570 | $8,680 |
| 2015 | $933 | $11,250 | $2,570 | $8,680 |
| 2014 | -- | $11,860 | $1,520 | $10,340 |
Source: Public Records
Map
Nearby Homes
- 7369 Whitehaven Dr
- 5 Grantview Ln
- 9008 Fernald Dr
- 8853 Raleigh Dr
- 8875 Rock Forest Dr
- 8942 Eden Ave
- 7636 Fort Henry Dr
- 8415 Rockhaven Ln
- 10610 Brookmere Dr
- 8736 New Hampshire Ave
- 8405 Rockhaven Ln
- 9742 Croftwood Dr
- 10161 Squire Meadows Dr Unit E
- 10161 Squire Meadows Dr Unit C
- 6426 Judson Ave
- 8554 Palmetto Dr
- 10300 Grant Forest Ln
- 10649 W Knollshire Dr
- 10360 Roscommon Dr
- 7243 General Sherman Ln
- 9026 S Laclede Station Rd Unit 1W
- 9026 S Laclede Station Rd Unit 9026
- 9028 S Laclede Station Rd Unit 2W
- 9026 S Laclede Station Rd Unit 1E
- 9028 S Laclede Station Rd Unit 1E
- 9028 S Laclede Station Rd Unit 2E
- 9026 S Laclede Station Rd Unit 2W
- 9028 S Laclede Station Rd Unit 1W
- 9026 S Laclede Station Rd Unit 2e
- 9026 S Laclede Station Rd
- 9030 S Laclede Station Rd Unit 1N
- 9030 S Laclede Station Rd Unit 2N
- 9030 S Laclede Station Rd Unit 2S
- 9024 S Laclede Station Rd Unit 1N
- 9024 S Laclede Station Rd Unit 2S
- 9024 S Laclede Station Rd Unit 2N
- 9024 S Laclede Station Rd Unit 1S
- 9020 S Laclede Station Rd
- 9018 S Laclede Station Rd
- 9022 S Laclede Station Rd