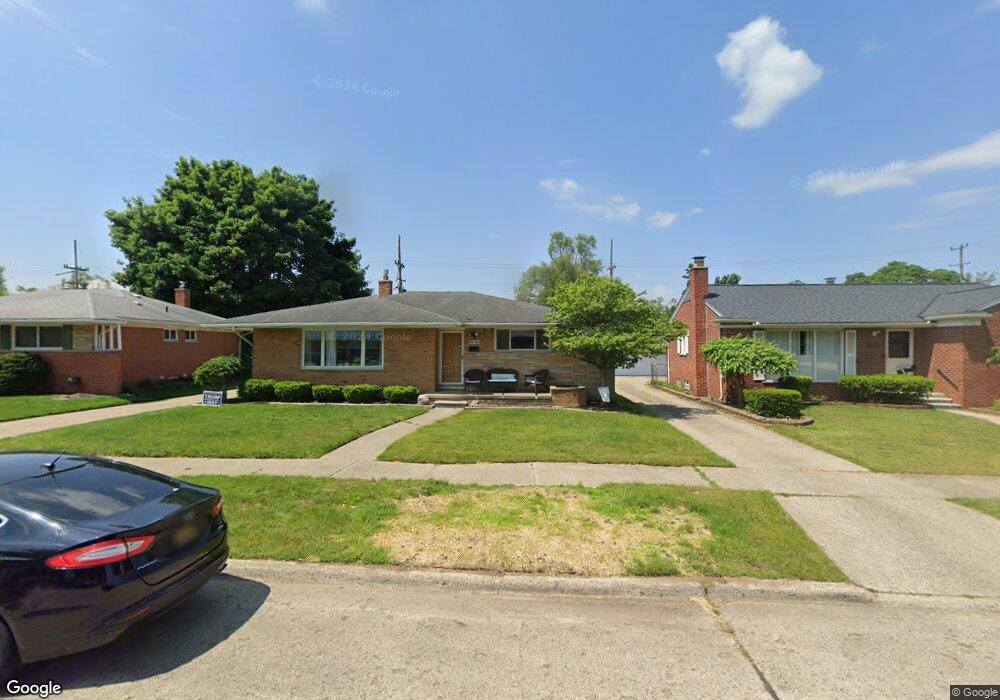
9031 Laurel St Livonia, MI 48150
Estimated Value: $292,000 - $301,910
3
Beds
2
Baths
1,264
Sq Ft
$235/Sq Ft
Est. Value
About This Home
This home is located at 9031 Laurel St, Livonia, MI 48150 and is currently estimated at $296,728, approximately $234 per square foot. 9031 Laurel St is a home located in Wayne County with nearby schools including Rosedale Elementary, Johnson Upper Elementary School, and Frost Middle School.
Ownership History
Date
Name
Owned For
Owner Type
Purchase Details
Closed on
Feb 14, 2011
Sold by
Grzembski Kenneth and Grzembski Kenneth E
Bought by
Jakubowski Aaron
Current Estimated Value
Purchase Details
Closed on
Oct 6, 2010
Sold by
Grzembski Kenneth E
Bought by
Bank Of America Na
Purchase Details
Closed on
Jan 20, 2006
Sold by
Grzembski Kenneth J and Grzembski Robin L
Bought by
Grzembski Kenneth E
Purchase Details
Closed on
Mar 1, 2001
Sold by
Peeler Gary L
Bought by
Grzembski Kenneth
Purchase Details
Closed on
Oct 3, 2000
Sold by
Michele C Peeler
Bought by
Gary L Peeler
Purchase Details
Closed on
Jun 24, 1994
Sold by
Edna M Gross Est
Bought by
Peeler Gary L and Peeler Michele E
Home Financials for this Owner
Home Financials are based on the most recent Mortgage that was taken out on this home.
Original Mortgage
$78,000
Interest Rate
8.38%
Mortgage Type
New Conventional
Create a Home Valuation Report for This Property
The Home Valuation Report is an in-depth analysis detailing your home's value as well as a comparison with similar homes in the area
Home Values in the Area
Average Home Value in this Area
Purchase History
| Date | Buyer | Sale Price | Title Company |
|---|---|---|---|
| Jakubowski Aaron | $75,000 | Title Connect Llc | |
| Bank Of America Na | $159,009 | None Available | |
| Grzembski Kenneth E | $190,000 | Fidelity National Title | |
| Grzembski Kenneth | $165,000 | -- | |
| Gary L Peeler | -- | -- | |
| Peeler Gary L | $97,500 | -- |
Source: Public Records
Mortgage History
| Date | Status | Borrower | Loan Amount |
|---|---|---|---|
| Previous Owner | Peeler Gary L | $78,000 |
Source: Public Records
Tax History Compared to Growth
Tax History
| Year | Tax Paid | Tax Assessment Tax Assessment Total Assessment is a certain percentage of the fair market value that is determined by local assessors to be the total taxable value of land and additions on the property. | Land | Improvement |
|---|---|---|---|---|
| 2025 | $1,698 | $134,100 | $0 | $0 |
| 2024 | $1,698 | $126,000 | $0 | $0 |
| 2023 | $1,620 | $111,400 | $0 | $0 |
| 2022 | $2,844 | $103,900 | $0 | $0 |
| 2021 | $2,763 | $99,100 | $0 | $0 |
| 2019 | $2,650 | $90,600 | $0 | $0 |
| 2018 | $1,369 | $82,100 | $0 | $0 |
| 2017 | $2,424 | $77,100 | $0 | $0 |
| 2016 | $2,548 | $77,100 | $0 | $0 |
| 2015 | $6,169 | $69,080 | $0 | $0 |
| 2012 | -- | $57,740 | $14,310 | $43,430 |
Source: Public Records
Map
Nearby Homes
- 8740 Oakridge Trail
- 34950 W Chicago St
- 35588 Dover St
- 35619 Dover St
- 33961 Richland St
- 35233 Orangelawn St
- 35912 Ann Arbor Trail
- 34080 Orangelawn St
- 10893 Laurel St
- 35845 Richland St
- 34934 Elmira St
- 9668 Farmington Rd
- 35527 Elmira St
- 33681 Elmira Ct
- 36356 Ann Arbor Trail
- 8228 Quincy Dr
- 36435 Grandon St
- 7860 Rivergate Dr Unit 25
- 33211 Anita Dr
- 9243 Montana St
- 9043 Laurel St
- 9023 Laurel St
- 9011 Laurel St
- 34649 Grandon St
- 9057 Laurel St
- 34665 Grandon St
- 9020 Wayne Rd
- 9032 Laurel St
- 34675 Grandon St
- 9024 Laurel St
- 9044 Laurel St
- 34587 Grandon St
- 9012 Laurel St
- 34685 Grandon St
- 34632 Grandon St
- 34648 Grandon St
- 34616 Grandon St
- 34573 Grandon St
- 34664 Grandon St
- 8961 Laurel Ave