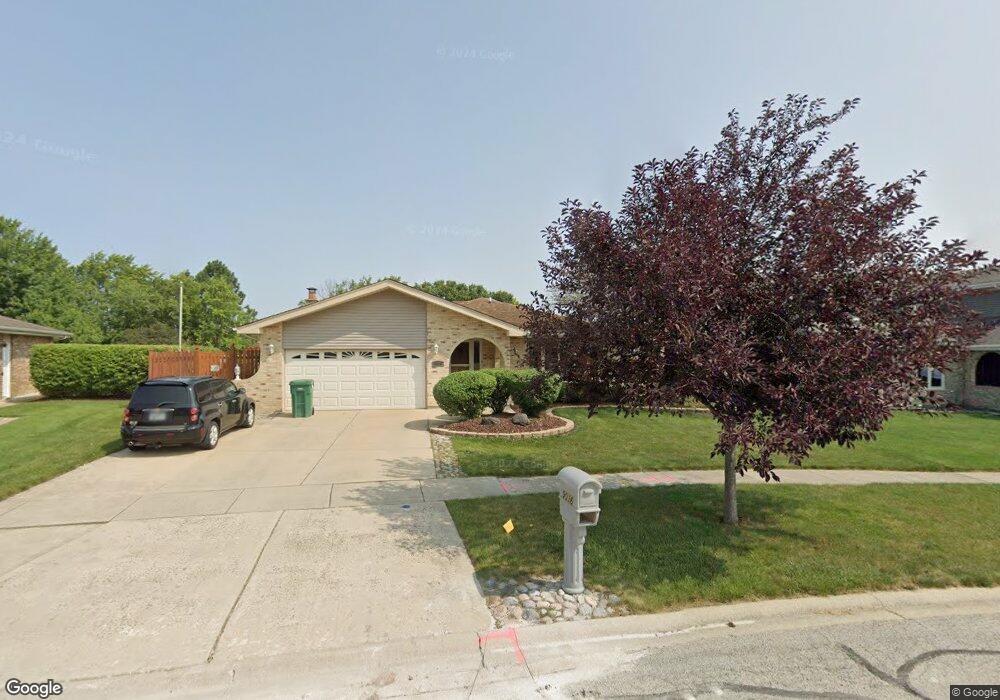
9036 Poplar St Tinley Park, IL 60487
Central Tinley Park NeighborhoodEstimated Value: $409,071 - $435,000
3
Beds
3
Baths
1,887
Sq Ft
$226/Sq Ft
Est. Value
About This Home
This home is located at 9036 Poplar St, Tinley Park, IL 60487 and is currently estimated at $426,518, approximately $226 per square foot. 9036 Poplar St is a home located in Cook County with nearby schools including Christa Mcauliffe School, Prairie View Middle School, and Victor J Andrew High School.
Ownership History
Date
Name
Owned For
Owner Type
Purchase Details
Closed on
Oct 25, 2004
Sold by
Mccue Edmund P and Mccue Margaret M
Bought by
Pedroza Doroteo and Pedroza Karen
Current Estimated Value
Home Financials for this Owner
Home Financials are based on the most recent Mortgage that was taken out on this home.
Original Mortgage
$92,000
Outstanding Balance
$46,308
Interest Rate
5.91%
Mortgage Type
New Conventional
Estimated Equity
$380,210
Create a Home Valuation Report for This Property
The Home Valuation Report is an in-depth analysis detailing your home's value as well as a comparison with similar homes in the area
Home Values in the Area
Average Home Value in this Area
Purchase History
| Date | Buyer | Sale Price | Title Company |
|---|---|---|---|
| Pedroza Doroteo | $255,500 | Atgf Inc |
Source: Public Records
Mortgage History
| Date | Status | Borrower | Loan Amount |
|---|---|---|---|
| Open | Pedroza Doroteo | $92,000 | |
| Closed | Pedroza Doroteo | $23,000 |
Source: Public Records
Tax History Compared to Growth
Tax History
| Year | Tax Paid | Tax Assessment Tax Assessment Total Assessment is a certain percentage of the fair market value that is determined by local assessors to be the total taxable value of land and additions on the property. | Land | Improvement |
|---|---|---|---|---|
| 2024 | $8,519 | $34,000 | $5,261 | $28,739 |
| 2023 | $7,765 | $34,000 | $5,261 | $28,739 |
| 2022 | $7,765 | $25,201 | $4,604 | $20,597 |
| 2021 | $7,546 | $25,200 | $4,603 | $20,597 |
| 2020 | $7,426 | $25,200 | $4,603 | $20,597 |
| 2019 | $7,925 | $27,866 | $4,165 | $23,701 |
| 2018 | $7,754 | $27,866 | $4,165 | $23,701 |
| 2017 | $7,566 | $27,866 | $4,165 | $23,701 |
| 2016 | $6,480 | $22,009 | $3,726 | $18,283 |
| 2015 | $6,370 | $22,009 | $3,726 | $18,283 |
| 2014 | $6,333 | $22,009 | $3,726 | $18,283 |
| 2013 | $6,927 | $25,567 | $3,726 | $21,841 |
Source: Public Records
Map
Nearby Homes
- 17533 Pecan Ln
- 17964 Upland Dr
- 9280 Windsor Pkwy Unit 92
- 9260 Windsor Pkwy Unit 80
- 9201 175th St
- 18055 Upland Dr
- 17631 Dover Ct
- Fremont Plan at Radcliffe Place
- Calysta Plan at Radcliffe Place
- Danbury Plan at Radcliffe Place
- Briarcliffe Plan at Radcliffe Place
- Eden Plan at Radcliffe Place
- Amberwood Plan at Radcliffe Place
- 9038 Mansfield Dr Unit 8
- 9051 Mansfield Dr Unit 1
- 17535 S La Grange Rd
- 17535-2 Lagrange Rd
- 18248 Murphy Cir Unit 182
- 17230 Shetland Dr
- 17500 Lagrange Rd