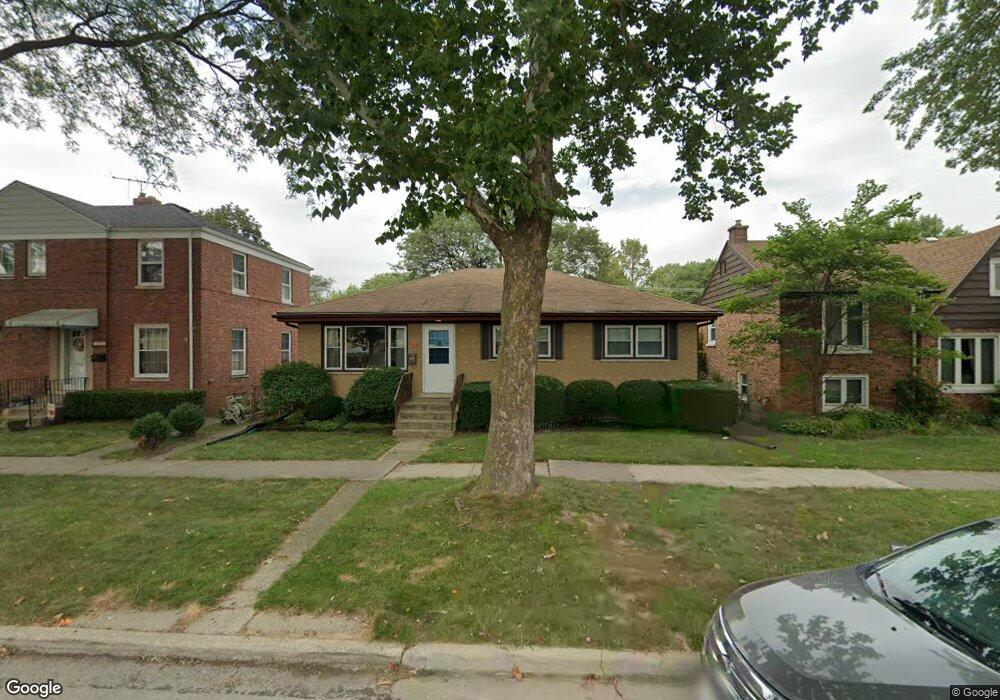
9038 Fairview Ave Brookfield, IL 60513
Estimated Value: $407,000 - $491,000
3
Beds
1
Bath
1,200
Sq Ft
$364/Sq Ft
Est. Value
About This Home
This home is located at 9038 Fairview Ave, Brookfield, IL 60513 and is currently estimated at $436,917, approximately $364 per square foot. 9038 Fairview Ave is a home located in Cook County with nearby schools including S. E. Gross Middle School, Brook Park Elementary School, and Riverside Brookfield High School.
Ownership History
Date
Name
Owned For
Owner Type
Purchase Details
Closed on
Mar 19, 2025
Sold by
Michael Wallace Wadland Trust and Jennifer Leigh Wadland Trust
Bought by
Clifford Thomas
Current Estimated Value
Home Financials for this Owner
Home Financials are based on the most recent Mortgage that was taken out on this home.
Original Mortgage
$414,000
Outstanding Balance
$411,578
Interest Rate
6.99%
Mortgage Type
New Conventional
Estimated Equity
$25,339
Purchase Details
Closed on
Jul 6, 2023
Sold by
Wadland Michael W and Wadland Jennifer L
Bought by
Michael Wallace Wadland Trust and Jennifer Leigh Wadland Trust
Purchase Details
Closed on
Mar 15, 2018
Sold by
Malaguit Jerson C
Bought by
Wadland Jennifer L and Wadland Michael W
Home Financials for this Owner
Home Financials are based on the most recent Mortgage that was taken out on this home.
Original Mortgage
$195,200
Interest Rate
4.87%
Mortgage Type
New Conventional
Create a Home Valuation Report for This Property
The Home Valuation Report is an in-depth analysis detailing your home's value as well as a comparison with similar homes in the area
Home Values in the Area
Average Home Value in this Area
Purchase History
| Date | Buyer | Sale Price | Title Company |
|---|---|---|---|
| Clifford Thomas | $460,000 | Fidelity National Title | |
| Michael Wallace Wadland Trust | -- | None Listed On Document | |
| Wadland Jennifer L | $244,000 | First American Title |
Source: Public Records
Mortgage History
| Date | Status | Borrower | Loan Amount |
|---|---|---|---|
| Open | Clifford Thomas | $414,000 | |
| Previous Owner | Wadland Jennifer L | $195,200 |
Source: Public Records
Tax History
| Year | Tax Paid | Tax Assessment Tax Assessment Total Assessment is a certain percentage of the fair market value that is determined by local assessors to be the total taxable value of land and additions on the property. | Land | Improvement |
|---|---|---|---|---|
| 2025 | $3,514 | $11,500 | $2,344 | $9,156 |
| 2024 | $3,514 | $11,500 | $2,344 | $9,156 |
| 2023 | $4,046 | $11,500 | $2,344 | $9,156 |
| 2022 | $4,046 | $11,420 | $2,031 | $9,389 |
| 2021 | $3,943 | $11,420 | $2,031 | $9,389 |
| 2020 | $3,886 | $11,420 | $2,031 | $9,389 |
| 2019 | $4,042 | $11,963 | $1,796 | $10,167 |
| 2018 | $3,879 | $11,963 | $1,796 | $10,167 |
| 2017 | $3,587 | $11,963 | $1,796 | $10,167 |
| 2016 | $3,335 | $10,208 | $1,640 | $8,568 |
| 2015 | $3,183 | $10,208 | $1,640 | $8,568 |
| 2014 | $3,147 | $10,208 | $1,640 | $8,568 |
| 2013 | $3,296 | $11,323 | $1,640 | $9,683 |
Source: Public Records
Map
Nearby Homes
- 9031 Fairview Ave
- 9016 Southview Ave
- 3545 Oak Ave
- 3730 Madison Ave
- 4023 Oak Ave
- 4032 Prairie Ave
- 3901 Custer Ave
- 3417 Oak Ave
- 3837 Morton Ave
- 4118 Prairie Ave
- 4021 Deyo Ave
- 8803 Ogden Ave
- 8636 40th St
- 4239 Park Ave
- 3845 Mccormick Ave
- 3601 Mccormick Ave
- 3321 Harrison Ave
- 3229 Maple Ave
- 4040 Rose Ave
- 4214 Deyo Ave
- 9042 Fairview Ave
- 9044 Fairview Ave
- 9034 Fairview Ave
- 9046 Fairview Ave
- 9030 Fairview Ave
- 9037 Sheridan Ave
- 3801 Park Ave
- 9039 Sheridan Ave
- 9039 Sheridan Ave Unit 2S
- 9026 Fairview Ave
- 9031 Sheridan Ave
- 9045 Sheridan Ave
- 9037 Fairview Ave
- 3805 Park Ave
- 9027 Sheridan Ave
- 9022 Fairview Ave
- 9029 Fairview Ave
- 9025 Sheridan Ave
- 3809 Park Ave
- 9018 Fairview Ave
Your Personal Tour Guide
Ask me questions while you tour the home.