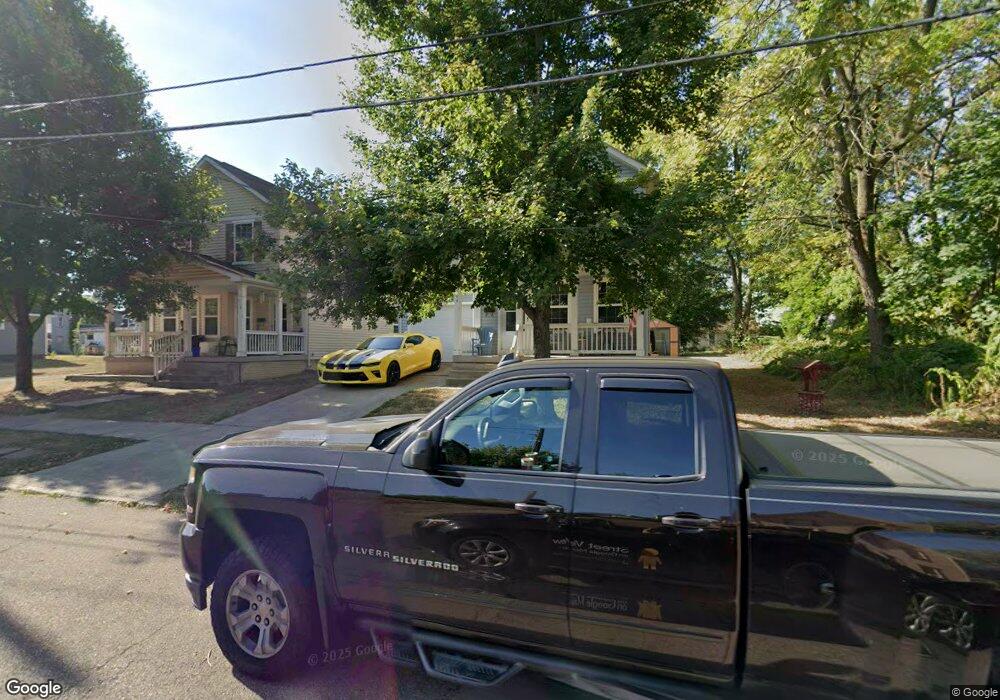
904 5th St NE Canton, OH 44704
Cherry Avenue NeighborhoodEstimated Value: $94,000 - $113,549
3
Beds
2
Baths
1,440
Sq Ft
$72/Sq Ft
Est. Value
About This Home
This home is located at 904 5th St NE, Canton, OH 44704 and is currently estimated at $104,137, approximately $72 per square foot. 904 5th St NE is a home located in Stark County with nearby schools including Early Learning Center @ Schreiber, Gibbs Elementary School, and Youtz Intermediate School.
Ownership History
Date
Name
Owned For
Owner Type
Purchase Details
Closed on
Jan 31, 2024
Sold by
Gateway Cherry Llc
Bought by
Cunningham Bradford and Cunningham Kisha
Current Estimated Value
Home Financials for this Owner
Home Financials are based on the most recent Mortgage that was taken out on this home.
Original Mortgage
$81,196
Outstanding Balance
$79,761
Interest Rate
6.61%
Mortgage Type
FHA
Estimated Equity
$24,376
Purchase Details
Closed on
Jul 8, 2020
Sold by
Abcd Gateway Place Llc
Bought by
Gateway Cherry Llc
Home Financials for this Owner
Home Financials are based on the most recent Mortgage that was taken out on this home.
Original Mortgage
$1,100,000
Interest Rate
3.1%
Mortgage Type
Commercial
Purchase Details
Closed on
Aug 8, 2002
Sold by
Garner John B and Garner Dorothy A
Bought by
Gateway Homes Llc
Create a Home Valuation Report for This Property
The Home Valuation Report is an in-depth analysis detailing your home's value as well as a comparison with similar homes in the area
Home Values in the Area
Average Home Value in this Area
Purchase History
| Date | Buyer | Sale Price | Title Company |
|---|---|---|---|
| Cunningham Bradford | $94,800 | None Listed On Document | |
| Gateway Cherry Llc | $690,000 | None Available | |
| Gateway Homes Llc | $5,000 | -- |
Source: Public Records
Mortgage History
| Date | Status | Borrower | Loan Amount |
|---|---|---|---|
| Open | Cunningham Bradford | $81,196 | |
| Closed | Cunningham Bradford | $1,909 | |
| Previous Owner | Gateway Cherry Llc | $1,100,000 |
Source: Public Records
Tax History Compared to Growth
Tax History
| Year | Tax Paid | Tax Assessment Tax Assessment Total Assessment is a certain percentage of the fair market value that is determined by local assessors to be the total taxable value of land and additions on the property. | Land | Improvement |
|---|---|---|---|---|
| 2025 | -- | $33,190 | $1,580 | $31,610 |
| 2024 | -- | $33,190 | $1,580 | $31,610 |
| 2023 | $742 | $12,190 | $1,930 | $10,260 |
| 2022 | $721 | $12,190 | $1,930 | $10,260 |
| 2021 | $728 | $12,190 | $1,930 | $10,260 |
| 2020 | $98 | $11,800 | $1,860 | $9,940 |
| 2019 | $689 | $11,800 | $1,860 | $9,940 |
| 2018 | $815 | $13,870 | $1,860 | $12,010 |
| 2017 | $762 | $11,700 | $2,490 | $9,210 |
| 2016 | $764 | $11,700 | $2,490 | $9,210 |
| 2015 | $763 | $11,700 | $2,490 | $9,210 |
| 2014 | $917 | $13,130 | $2,800 | $10,330 |
| 2013 | $443 | $13,130 | $2,800 | $10,330 |
Source: Public Records
Map
Nearby Homes
- 1120 6th St NE
- 0 3rd St SE Unit 5132035
- 1427 4th St NE
- 1511 2nd St NE
- 1710 4th St NE
- 0 Young Ave NE Unit 5145944
- 722 High Ave NW
- 1811 3rd St SE
- 1855 7th St NE
- 1005 Dewalt Ave NW
- 1007 Dewalt Ave NW
- 1332 Spring Ave NE
- 905 High Ave NW
- 1226 Logan Ave NW
- 1322 Struble Ave NE
- 916 6th St NW
- 806 Troy Place NW
- 1945 Otto Place NE
- 811 Troy Place NW
- 1605 12th St NE