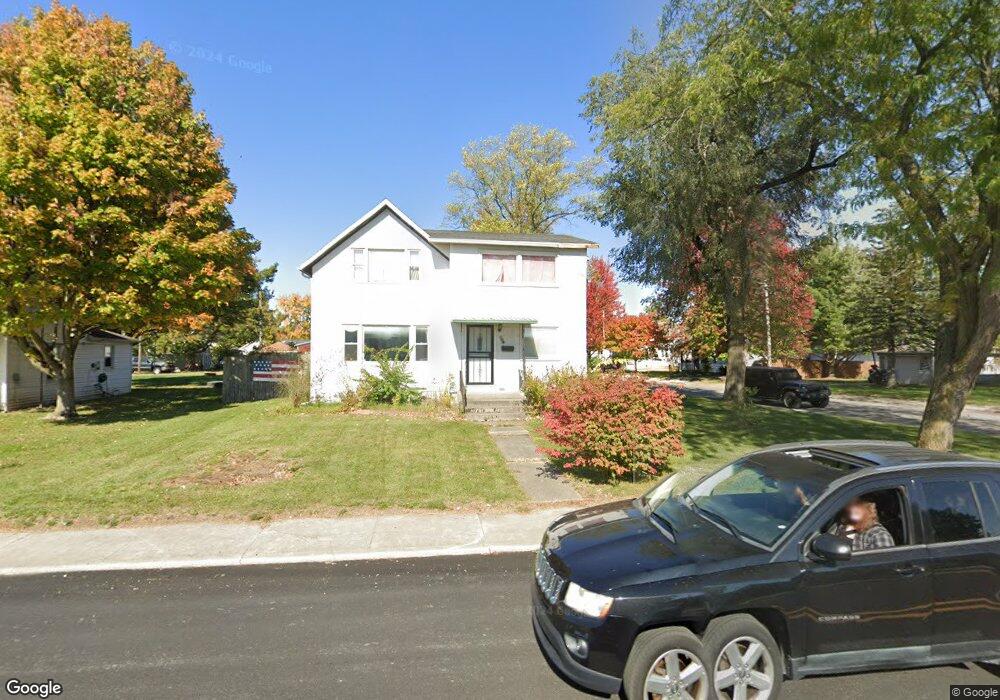
904 Adams St Decatur, IN 46733
Estimated Value: $81,000 - $168,541
4
Beds
2
Baths
2,424
Sq Ft
$57/Sq Ft
Est. Value
About This Home
This home is located at 904 Adams St, Decatur, IN 46733 and is currently estimated at $139,135, approximately $57 per square foot. 904 Adams St is a home located in Adams County with nearby schools including Southeast Elementary School, Bellmont Elementary School, and Bellmont Middle School.
Ownership History
Date
Name
Owned For
Owner Type
Purchase Details
Closed on
Aug 25, 2010
Sold by
Federal Home Loan Mortgage Corporation
Bought by
Jacobs Alice I
Current Estimated Value
Purchase Details
Closed on
May 26, 2010
Sold by
Findley Henry
Bought by
Federal Home Loan Mortgage Corporation
Purchase Details
Closed on
Sep 27, 2006
Sold by
Marks Heating Air Conditioning And Refri
Bought by
Findley Henry and Findley Sharon
Home Financials for this Owner
Home Financials are based on the most recent Mortgage that was taken out on this home.
Original Mortgage
$44,000
Interest Rate
6.49%
Mortgage Type
New Conventional
Create a Home Valuation Report for This Property
The Home Valuation Report is an in-depth analysis detailing your home's value as well as a comparison with similar homes in the area
Home Values in the Area
Average Home Value in this Area
Purchase History
| Date | Buyer | Sale Price | Title Company |
|---|---|---|---|
| Jacobs Alice I | -- | -- | |
| Federal Home Loan Mortgage Corporation | $11,136 | -- | |
| Findley Henry | -- | -- |
Source: Public Records
Mortgage History
| Date | Status | Borrower | Loan Amount |
|---|---|---|---|
| Previous Owner | Findley Henry | $44,000 |
Source: Public Records
Tax History Compared to Growth
Tax History
| Year | Tax Paid | Tax Assessment Tax Assessment Total Assessment is a certain percentage of the fair market value that is determined by local assessors to be the total taxable value of land and additions on the property. | Land | Improvement |
|---|---|---|---|---|
| 2024 | $1,462 | $73,100 | $13,800 | $59,300 |
| 2023 | $1,344 | $67,200 | $13,800 | $53,400 |
| 2022 | $1,234 | $61,700 | $13,800 | $47,900 |
| 2021 | $1,148 | $57,400 | $13,500 | $43,900 |
| 2020 | $1,148 | $57,400 | $13,500 | $43,900 |
| 2019 | $1,148 | $57,400 | $13,500 | $43,900 |
| 2018 | $1,116 | $55,800 | $13,500 | $42,300 |
| 2017 | $1,082 | $54,100 | $13,100 | $41,000 |
| 2016 | $1,064 | $53,200 | $13,100 | $40,100 |
| 2014 | $1,060 | $53,000 | $13,200 | $39,800 |
| 2013 | $1,068 | $53,400 | $13,100 | $40,300 |
Source: Public Records
Map
Nearby Homes