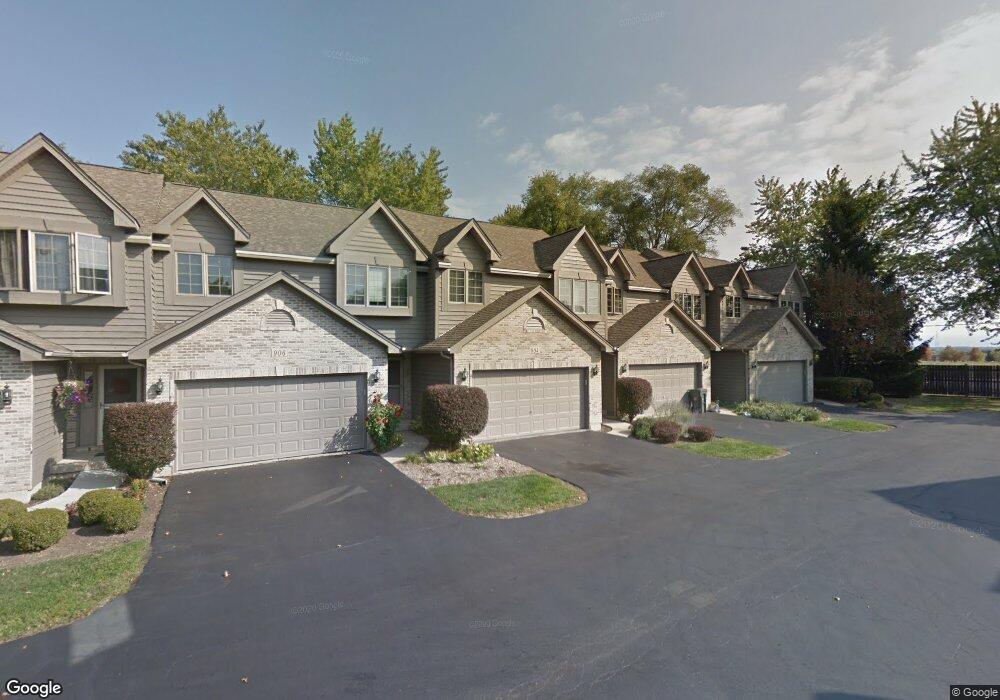
904 Ascot Dr Elgin, IL 60123
College Green NeighborhoodEstimated Value: $283,387 - $294,000
2
Beds
2
Baths
1,449
Sq Ft
$198/Sq Ft
Est. Value
About This Home
This home is located at 904 Ascot Dr, Elgin, IL 60123 and is currently estimated at $287,597, approximately $198 per square foot. 904 Ascot Dr is a home located in Kane County with nearby schools including Otter Creek Elementary School, Abbott Middle School, and South Elgin High School.
Ownership History
Date
Name
Owned For
Owner Type
Purchase Details
Closed on
Jul 15, 2005
Sold by
Thrun Todd A
Bought by
Sandifer Ira and Sandifer Felicia M
Current Estimated Value
Home Financials for this Owner
Home Financials are based on the most recent Mortgage that was taken out on this home.
Original Mortgage
$201,832
Outstanding Balance
$105,495
Interest Rate
5.68%
Mortgage Type
FHA
Estimated Equity
$182,102
Purchase Details
Closed on
Mar 22, 2002
Sold by
Todd Debbie J
Bought by
Thrun Todd A
Home Financials for this Owner
Home Financials are based on the most recent Mortgage that was taken out on this home.
Original Mortgage
$116,000
Interest Rate
6.82%
Mortgage Type
Purchase Money Mortgage
Purchase Details
Closed on
Nov 19, 1995
Sold by
Nielson Mark R and Nielson Judy M
Bought by
Todd Debbie J
Home Financials for this Owner
Home Financials are based on the most recent Mortgage that was taken out on this home.
Original Mortgage
$96,750
Interest Rate
7.52%
Mortgage Type
Purchase Money Mortgage
Create a Home Valuation Report for This Property
The Home Valuation Report is an in-depth analysis detailing your home's value as well as a comparison with similar homes in the area
Home Values in the Area
Average Home Value in this Area
Purchase History
| Date | Buyer | Sale Price | Title Company |
|---|---|---|---|
| Sandifer Ira | $205,000 | Fatic | |
| Thrun Todd A | $145,000 | First American Title Co | |
| Todd Debbie J | $129,000 | -- |
Source: Public Records
Mortgage History
| Date | Status | Borrower | Loan Amount |
|---|---|---|---|
| Open | Sandifer Ira | $201,832 | |
| Previous Owner | Thrun Todd A | $116,000 | |
| Previous Owner | Todd Debbie J | $96,750 |
Source: Public Records
Tax History
| Year | Tax Paid | Tax Assessment Tax Assessment Total Assessment is a certain percentage of the fair market value that is determined by local assessors to be the total taxable value of land and additions on the property. | Land | Improvement |
|---|---|---|---|---|
| 2024 | $5,197 | $72,945 | $13,077 | $59,868 |
| 2023 | $4,936 | $65,900 | $11,814 | $54,086 |
| 2022 | $4,690 | $60,089 | $10,772 | $49,317 |
| 2021 | $4,477 | $56,179 | $10,071 | $46,108 |
| 2020 | $4,344 | $53,631 | $9,614 | $44,017 |
| 2019 | $4,211 | $51,087 | $9,158 | $41,929 |
| 2018 | $4,813 | $54,684 | $8,627 | $46,057 |
| 2017 | $4,700 | $51,696 | $8,156 | $43,540 |
| 2016 | $4,475 | $47,960 | $7,567 | $40,393 |
| 2015 | -- | $43,960 | $6,936 | $37,024 |
| 2014 | -- | $38,216 | $6,850 | $31,366 |
| 2013 | -- | $39,224 | $7,031 | $32,193 |
Source: Public Records
Map
Nearby Homes
- 1502 Sawgrass Ct
- 746 Fieldcrest Dr Unit B
- 1661 College Green Dr
- 1633 Pebble Beach Cir Unit 6
- 1670 College Green Dr Unit 2
- 690 Renee Dr Unit 8
- 1780 College Green Dr Unit 7
- 1880 Gleneagle Cir
- 1780 Pebble Beach Cir
- 27 Frederick Ct
- 920 Gerald Ave Unit 6
- 1264 Sandhurst Ln Unit 3
- 1207 Sandhurst Ln Unit C
- 974 Annandale Dr
- 1032 Blazing Star St
- 404 Lowell Dr Unit 3
- 565 Dean Dr Unit F
- 444 Radcliff Ln
- 714 Division St Unit G1-G2
- 2046 Mission Hills Dr
- 902 Ascot Dr
- 906 Ascot Dr Unit A
- 900 Ascot Dr
- 908 Ascot Dr
- 911 Ascot Dr
- 913 Ascot Dr
- 35W691 Crispin Dr
- 915 Ascot Dr
- 915 Ascot Dr Unit 915
- 910 Ascot Dr
- 912 Ascot Dr
- 35W705 Crispin Dr
- 976 S Mclean Blvd
- 914 Ascot Dr
- 914 Ascot Dr Unit 914
- 917 Ascot Dr
- 916 Ascot Dr
- 35W715 Crispin Dr
- 918 Ascot Dr
- 1504 Arbor Ln
Your Personal Tour Guide
Ask me questions while you tour the home.