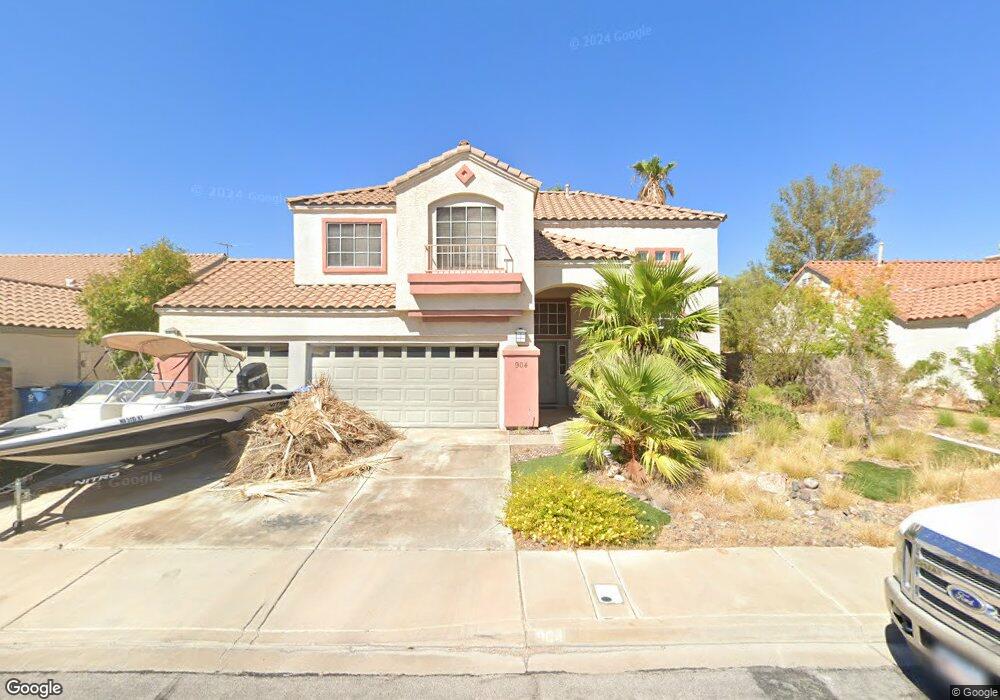
904 Blanco Caballo Way Henderson, NV 89015
River Mountain NeighborhoodEstimated Value: $481,000 - $531,000
4
Beds
3
Baths
2,270
Sq Ft
$222/Sq Ft
Est. Value
About This Home
This home is located at 904 Blanco Caballo Way, Henderson, NV 89015 and is currently estimated at $503,234, approximately $221 per square foot. 904 Blanco Caballo Way is a home located in Clark County with nearby schools including Sue H. Morrow Elementary School, B Mahlon Brown Academy of International Studies, and Basic Academy of International Studies.
Ownership History
Date
Name
Owned For
Owner Type
Purchase Details
Closed on
Jul 18, 2000
Sold by
Johnson Ernest Kim and Johnson Karen C
Bought by
Shaw Nathan G
Current Estimated Value
Home Financials for this Owner
Home Financials are based on the most recent Mortgage that was taken out on this home.
Original Mortgage
$154,850
Outstanding Balance
$54,979
Interest Rate
8.12%
Estimated Equity
$448,255
Purchase Details
Closed on
Aug 30, 1995
Sold by
Hansen Gerald E and Hansen Betty L
Bought by
Johnson Ernest Kim and Johnson Karen C
Home Financials for this Owner
Home Financials are based on the most recent Mortgage that was taken out on this home.
Original Mortgage
$157,998
Interest Rate
7.88%
Mortgage Type
Assumption
Purchase Details
Closed on
Jun 14, 1994
Sold by
Terra West Development
Bought by
Hansen Gerald E and Hansen Betty L
Create a Home Valuation Report for This Property
The Home Valuation Report is an in-depth analysis detailing your home's value as well as a comparison with similar homes in the area
Home Values in the Area
Average Home Value in this Area
Purchase History
| Date | Buyer | Sale Price | Title Company |
|---|---|---|---|
| Shaw Nathan G | $163,000 | Stewart Title | |
| Johnson Ernest Kim | $160,000 | Old Republic Title Company | |
| Hansen Gerald E | $130,000 | United Title |
Source: Public Records
Mortgage History
| Date | Status | Borrower | Loan Amount |
|---|---|---|---|
| Open | Shaw Nathan G | $154,850 | |
| Previous Owner | Johnson Ernest Kim | $157,998 |
Source: Public Records
Tax History Compared to Growth
Tax History
| Year | Tax Paid | Tax Assessment Tax Assessment Total Assessment is a certain percentage of the fair market value that is determined by local assessors to be the total taxable value of land and additions on the property. | Land | Improvement |
|---|---|---|---|---|
| 2025 | $1,839 | $96,724 | $29,050 | $67,674 |
| 2024 | $1,786 | $96,724 | $29,050 | $67,674 |
| 2023 | $1,786 | $98,191 | $33,600 | $64,591 |
| 2022 | $1,900 | $86,556 | $27,300 | $59,256 |
| 2021 | $1,760 | $81,430 | $24,850 | $56,580 |
| 2020 | $1,631 | $81,097 | $24,850 | $56,247 |
| 2019 | $1,529 | $76,956 | $21,350 | $55,606 |
| 2018 | $1,459 | $70,482 | $17,150 | $53,332 |
| 2017 | $2,048 | $70,648 | $16,450 | $54,198 |
| 2016 | $1,366 | $63,237 | $8,750 | $54,487 |
| 2015 | $1,363 | $52,387 | $8,750 | $43,637 |
| 2014 | $1,320 | $44,225 | $8,050 | $36,175 |
Source: Public Records
Map
Nearby Homes
- 902 Blanco Caballo Way
- 885 High Mountain St
- 635 Pimlico Dr
- 987 Blue Lantern Dr
- 881 Dunkirk River Ct
- 538 Ancient Mayan Dr
- 884 Cozy Valley St
- 977 Trackers Glen Ave
- 994 River Walk Ct
- 834 Dulce Fountain Way
- 690 Ambling Gait Ave
- 840 Candido Garcia Ave
- 991 Hidden Meadow Ave
- 916 Twinkling Sky Ave
- 915 Graceful Moon Ave
- 512 Amber Moon St
- 698 S Racetrack Rd Unit 724
- 698 S Racetrack Rd Unit 1411
- 698 S Racetrack Rd Unit 322
- 698 S Racetrack Rd Unit 1521
- 906 Blanco Caballo Way
- 908 Blanco Caballo Way
- 903 Blanco Caballo Way
- 905 Blanco Caballo Way
- 905 Blanco Caballo Way Unit HOUSE
- 901 Blanco Caballo Way
- 907 Blanco Caballo Way
- 910 Blanco Caballo Way
- 609 Pimlico Dr
- 611 Pimlico Dr
- 613 Pimlico Dr
- 605 Pimlico Dr
- 904 Noche de Paz Ave
- 911 Picante Pepper Dr
- 906 Noche de Paz Ave
- 909 Blanco Caballo Way
- 908 Noche de Paz Ave
- 912 Blanco Caballo Way
- 615 Pimlico Dr