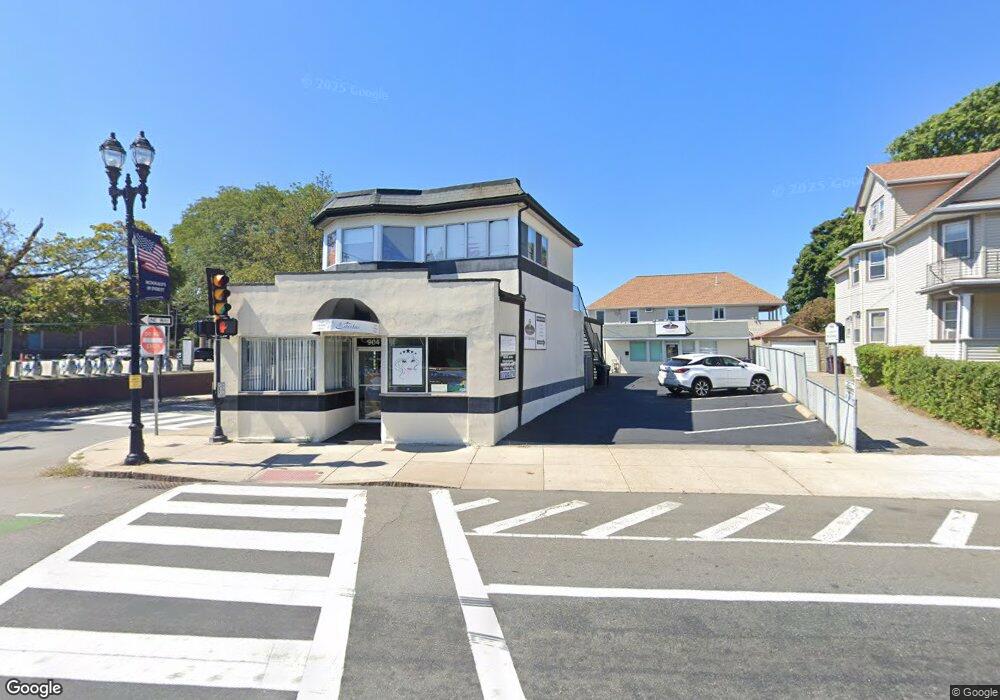
904 Broadway Unit 2 Everett, MA 02149
Glendale NeighborhoodEstimated Value: $936,648
Studio
--
Bath
2,956
Sq Ft
$317/Sq Ft
Est. Value
About This Home
This home is located at 904 Broadway Unit 2, Everett, MA 02149 and is currently estimated at $936,648, approximately $316 per square foot. 904 Broadway Unit 2 is a home located in Middlesex County with nearby schools including Malden High School.
Ownership History
Date
Name
Owned For
Owner Type
Purchase Details
Closed on
Apr 5, 2017
Sold by
904-908 Broadway Rt
Bought by
R & P Properties Llc
Current Estimated Value
Home Financials for this Owner
Home Financials are based on the most recent Mortgage that was taken out on this home.
Original Mortgage
$405,000
Outstanding Balance
$336,559
Interest Rate
4.16%
Mortgage Type
Commercial
Estimated Equity
$600,089
Purchase Details
Closed on
May 31, 2001
Sold by
Bochetti Joseph M
Bought by
904-908 Broadway Rt
Home Financials for this Owner
Home Financials are based on the most recent Mortgage that was taken out on this home.
Original Mortgage
$275,000
Interest Rate
7.09%
Mortgage Type
Commercial
Create a Home Valuation Report for This Property
The Home Valuation Report is an in-depth analysis detailing your home's value as well as a comparison with similar homes in the area
Home Values in the Area
Average Home Value in this Area
Purchase History
| Date | Buyer | Sale Price | Title Company |
|---|---|---|---|
| R & P Properties Llc | $540,000 | -- | |
| 904-908 Broadway Rt | $275,000 | -- |
Source: Public Records
Mortgage History
| Date | Status | Borrower | Loan Amount |
|---|---|---|---|
| Open | R & P Properties Llc | $405,000 | |
| Previous Owner | 904-908 Broadway Rt | $275,000 |
Source: Public Records
Tax History
| Year | Tax Paid | Tax Assessment Tax Assessment Total Assessment is a certain percentage of the fair market value that is determined by local assessors to be the total taxable value of land and additions on the property. | Land | Improvement |
|---|---|---|---|---|
| 2025 | $0 | $832,100 | $516,400 | $315,700 |
| 2024 | $0 | $771,100 | $475,100 | $296,000 |
| 2023 | $0 | $717,100 | $433,800 | $283,300 |
| 2022 | $0 | $683,500 | $408,000 | $275,500 |
| 2021 | $0 | $653,300 | $387,300 | $266,000 |
| 2020 | $15,017 | $607,500 | $351,200 | $256,300 |
| 2019 | $21,106 | $598,400 | $351,200 | $247,200 |
| 2018 | $15,318 | $454,000 | $201,600 | $252,400 |
| 2017 | $15,900 | $445,500 | $186,600 | $258,900 |
| 2016 | $16,274 | $428,500 | $179,200 | $249,300 |
| 2015 | $16,904 | $428,500 | $179,200 | $249,300 |
Source: Public Records
Map
Nearby Homes
- 5 Mason St
- 881 Broadway Unit 44
- 51 Thurman St
- 859 Broadway Unit 15
- 112 Hadley St
- 13 Coolidge St
- 378 Ferry St
- 132 Vernal St
- 51 Adams Ave
- 19 Mills St
- 21 Hillside Ave Unit 21
- 211 Elm St
- 272-274 Cross St Unit 4
- 272-274 Cross St Unit 3
- 62 Madison Ave
- 20 Fairmount St
- 21 Central Ave Unit 10
- 40-42 Upham St Unit 1
- 21 Staples Ave Unit 26
- 15 Staples Ave Unit 45
Your Personal Tour Guide
Ask me questions while you tour the home.