Estimated Value: $152,000 - $190,000
3
Beds
1
Bath
1,056
Sq Ft
$155/Sq Ft
Est. Value
About This Home
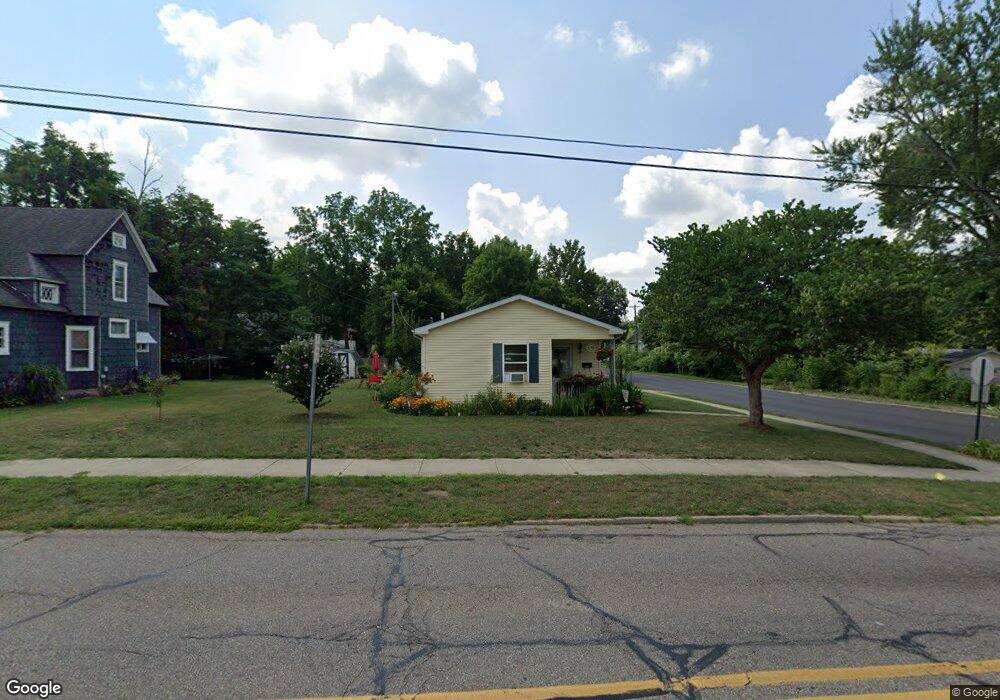
This home is located at 904 Broadway St, Niles, MI 49120 and is currently estimated at $163,560, approximately $154 per square foot. 904 Broadway St is a home located in Berrien County with nearby schools including Ballard Elementary School, Oak Manor Sixth Grade Center, and Ring Lardner Middle School.
Ownership History
Date
Name
Owned For
Owner Type
Purchase Details
Closed on
Nov 17, 2003
Sold by
Habitat For Humanity Of Niles Buchanan A
Bought by
Kirkendoll Rodney and Kirkendoll Linda
Current Estimated Value
Home Financials for this Owner
Home Financials are based on the most recent Mortgage that was taken out on this home.
Original Mortgage
$61,883
Outstanding Balance
$28,709
Interest Rate
6.01%
Mortgage Type
Seller Take Back
Estimated Equity
$134,851
Purchase Details
Closed on
Aug 27, 2001
Purchase Details
Closed on
Feb 17, 1988
Purchase Details
Closed on
Jun 2, 1986
Create a Home Valuation Report for This Property
The Home Valuation Report is an in-depth analysis detailing your home's value as well as a comparison with similar homes in the area
Home Values in the Area
Average Home Value in this Area
Purchase History
| Date | Buyer | Sale Price | Title Company |
|---|---|---|---|
| Kirkendoll Rodney | $61,883 | -- | |
| -- | $100 | -- | |
| -- | -- | -- | |
| -- | -- | -- |
Source: Public Records
Mortgage History
| Date | Status | Borrower | Loan Amount |
|---|---|---|---|
| Open | Kirkendoll Rodney | $61,883 | |
| Closed | Kirkendoll Rodney | $10,800 |
Source: Public Records
Tax History Compared to Growth
Tax History
| Year | Tax Paid | Tax Assessment Tax Assessment Total Assessment is a certain percentage of the fair market value that is determined by local assessors to be the total taxable value of land and additions on the property. | Land | Improvement |
|---|---|---|---|---|
| 2025 | $1,677 | $73,500 | $0 | $0 |
| 2024 | $1,321 | $65,300 | $0 | $0 |
| 2023 | $1,266 | $58,800 | $0 | $0 |
| 2022 | $1,206 | $45,700 | $0 | $0 |
| 2021 | $1,477 | $42,500 | $3,600 | $38,900 |
| 2020 | $1,461 | $39,600 | $0 | $0 |
| 2019 | $1,443 | $37,300 | $2,400 | $34,900 |
| 2018 | $1,434 | $37,300 | $0 | $0 |
| 2017 | $1,500 | $45,400 | $0 | $0 |
| 2016 | $1,468 | $41,800 | $0 | $0 |
| 2015 | $1,463 | $41,000 | $0 | $0 |
| 2014 | $1,146 | $38,800 | $0 | $0 |
Source: Public Records
Map
Nearby Homes