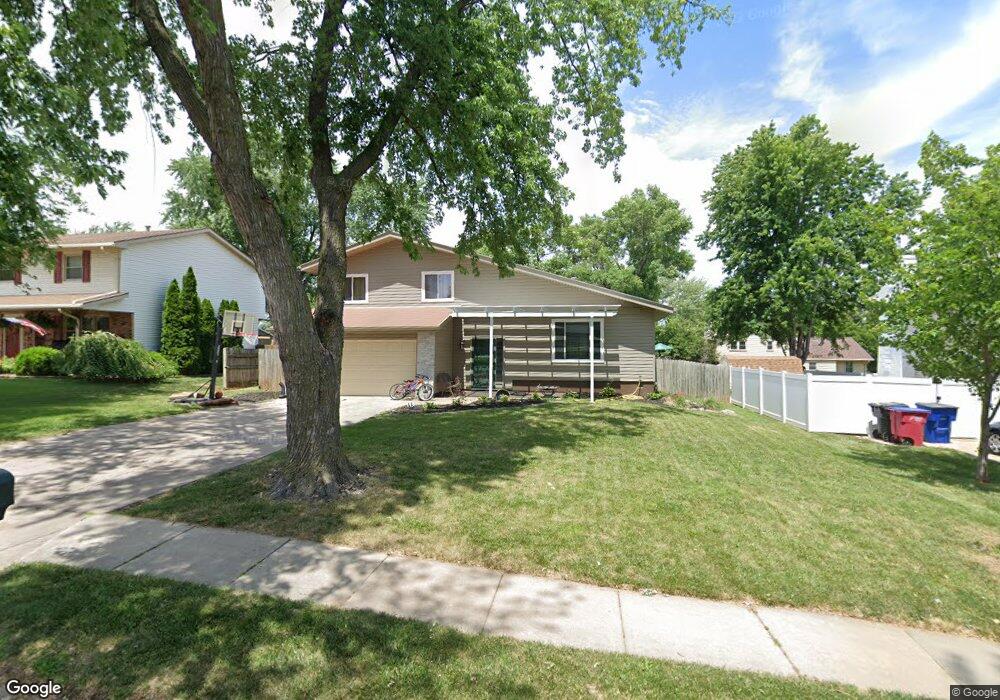
904 Crest Rd Papillion, NE 68046
Estimated Value: $247,000 - $319,000
3
Beds
3
Baths
2,015
Sq Ft
$141/Sq Ft
Est. Value
About This Home
This home is located at 904 Crest Rd, Papillion, NE 68046 and is currently estimated at $284,740, approximately $141 per square foot. 904 Crest Rd is a home located in Sarpy County with nearby schools including Trumble Park Elementary School, Papillion Middle School, and Papillion La Vista South High School.
Ownership History
Date
Name
Owned For
Owner Type
Purchase Details
Closed on
Nov 7, 2019
Sold by
Jochim Edwin C
Bought by
Deras Guadalupe
Current Estimated Value
Home Financials for this Owner
Home Financials are based on the most recent Mortgage that was taken out on this home.
Original Mortgage
$185,365
Outstanding Balance
$167,995
Interest Rate
5.25%
Mortgage Type
Purchase Money Mortgage
Estimated Equity
$116,745
Purchase Details
Closed on
Sep 22, 2015
Sold by
Kritenbrink Mark
Bought by
Deras Guadalupe and Jochim Edwin C
Home Financials for this Owner
Home Financials are based on the most recent Mortgage that was taken out on this home.
Original Mortgage
$128,627
Interest Rate
3.87%
Mortgage Type
FHA
Purchase Details
Closed on
Jun 21, 2000
Sold by
Falcione Albert A and Falcione Marilyn A
Bought by
Kritenbrink Mark
Home Financials for this Owner
Home Financials are based on the most recent Mortgage that was taken out on this home.
Original Mortgage
$93,750
Interest Rate
8.15%
Create a Home Valuation Report for This Property
The Home Valuation Report is an in-depth analysis detailing your home's value as well as a comparison with similar homes in the area
Home Values in the Area
Average Home Value in this Area
Purchase History
| Date | Buyer | Sale Price | Title Company |
|---|---|---|---|
| Deras Guadalupe | $81,000 | Nebraska Title Co Papill | |
| Deras Guadalupe | $131,000 | Dri Title & Escrow | |
| Kritenbrink Mark | $125,000 | -- |
Source: Public Records
Mortgage History
| Date | Status | Borrower | Loan Amount |
|---|---|---|---|
| Open | Deras Guadalupe | $185,365 | |
| Previous Owner | Deras Guadalupe | $128,627 | |
| Previous Owner | Kritenbrink Mark | $93,750 | |
| Closed | Kritenbrink Mark | $25,000 |
Source: Public Records
Tax History Compared to Growth
Tax History
| Year | Tax Paid | Tax Assessment Tax Assessment Total Assessment is a certain percentage of the fair market value that is determined by local assessors to be the total taxable value of land and additions on the property. | Land | Improvement |
|---|---|---|---|---|
| 2025 | $3,492 | $251,471 | $44,000 | $207,471 |
| 2024 | $4,064 | $234,366 | $40,000 | $194,366 |
| 2023 | $4,064 | $215,824 | $35,000 | $180,824 |
| 2022 | $3,839 | $188,115 | $33,000 | $155,115 |
| 2021 | $3,685 | $176,995 | $29,000 | $147,995 |
| 2020 | $3,600 | $171,199 | $29,000 | $142,199 |
| 2019 | $3,390 | $161,335 | $27,000 | $134,335 |
| 2018 | $3,283 | $153,863 | $24,000 | $129,863 |
| 2017 | $3,090 | $144,827 | $22,000 | $122,827 |
| 2016 | $2,931 | $137,613 | $22,000 | $115,613 |
| 2015 | $2,565 | $120,781 | $22,000 | $98,781 |
| 2014 | $2,569 | $120,126 | $22,000 | $98,126 |
| 2012 | -- | $118,426 | $22,000 | $96,426 |
Source: Public Records
Map
Nearby Homes
- 906 Chisholm Trail
- 801 S Fillmore St
- 907 Woodland Ave
- Lot 130 Shadow Lake 2
- TBD Slayton St
- Lot 28 Ashbury Hills
- 12378 Lake Vista Dr
- 262 Ashbury Hills St
- 259 Ashbury Hils St
- 235 Lot St
- 809 Buckboard Blvd
- Lot 71 N Shore Commercial
- Lot 39
- 613 Valley Rd
- 704 Valley Rd
- 309 S Fillmore St
- 308 Crest Rd
- 1210 Devon Dr
- LOT 293 Granite Lake
- Lot 289 Granite Lake
- 906 Crest Rd
- 900 Crest Rd
- 903 Lariat Cir
- 901 Lariat Cir
- 908 Crest Rd
- 905 Lariat Cir
- 903 Crest Rd
- 905 Crest Rd
- 901 Crest Rd
- 907 Crest Rd
- 904 Chisholm Trail
- 904 Lariat Cir
- 902 Chisholm Trail
- 909 Crest Rd
- 908 Chisholm Trail
- 913 W Perry St
- 911 W Perry St
- 809 Chisholm Trail
- 912 Crest Rd
- 900 Chisholm Trail