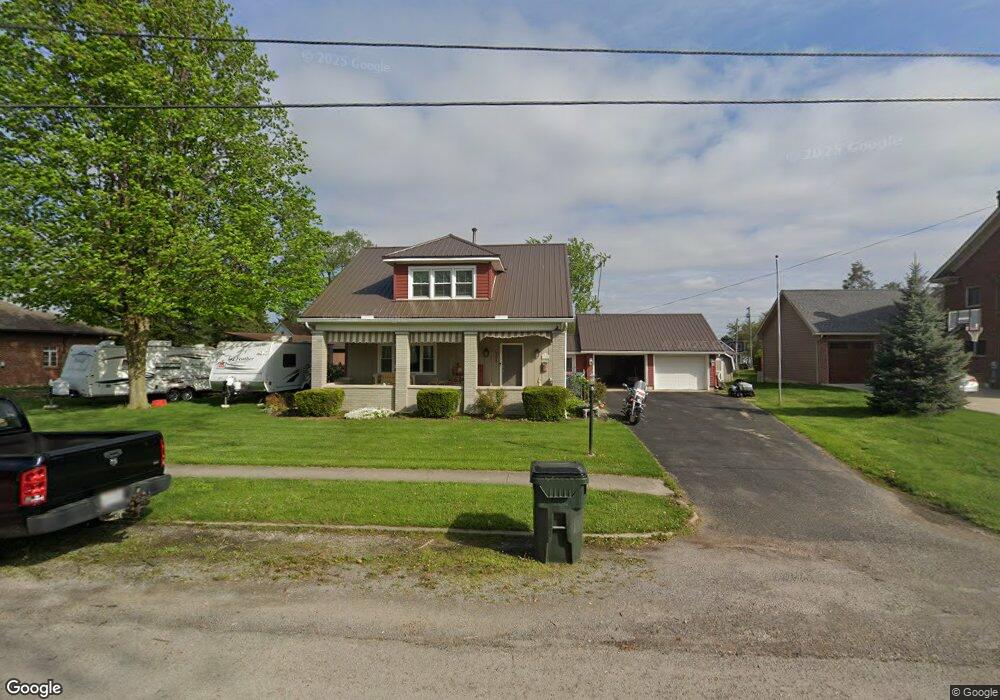
904 E 2nd St Delphos, OH 45833
Estimated Value: $189,000 - $312,000
4
Beds
2
Baths
1,550
Sq Ft
$145/Sq Ft
Est. Value
About This Home
This home is located at 904 E 2nd St, Delphos, OH 45833 and is currently estimated at $225,203, approximately $145 per square foot. 904 E 2nd St is a home located in Allen County with nearby schools including Delphos St. John's High School and Delphos St. John's Elementary School.
Ownership History
Date
Name
Owned For
Owner Type
Purchase Details
Closed on
Sep 11, 2018
Sold by
Stemen Dennis M and Stemen Kathy L
Bought by
Stemen David and The Stemen Irrevocable Heritag
Current Estimated Value
Purchase Details
Closed on
Aug 26, 2015
Sold by
Karhoff Ryan J and Karhoff Kristen M
Bought by
Stemen Dennis M and Stemen Kathy L
Purchase Details
Closed on
Jan 26, 2013
Sold by
Stemen Kathy L and Stemen Dennis M
Bought by
Karhoff Ryan J and Karhoff Kristen M
Purchase Details
Closed on
Feb 4, 2005
Sold by
Morton Susan R and Polley Leslie S
Bought by
Stemen Dennis M and Stemen Kathy L
Home Financials for this Owner
Home Financials are based on the most recent Mortgage that was taken out on this home.
Original Mortgage
$100,000
Interest Rate
5.79%
Mortgage Type
New Conventional
Purchase Details
Closed on
Jun 1, 1983
Bought by
Morton Susan R
Create a Home Valuation Report for This Property
The Home Valuation Report is an in-depth analysis detailing your home's value as well as a comparison with similar homes in the area
Home Values in the Area
Average Home Value in this Area
Purchase History
| Date | Buyer | Sale Price | Title Company |
|---|---|---|---|
| Stemen David | -- | None Available | |
| Stemen Dennis M | -- | None Available | |
| Karhoff Ryan J | $125,000 | None Available | |
| Stemen Dennis M | $133,000 | None Available | |
| Morton Susan R | -- | -- |
Source: Public Records
Mortgage History
| Date | Status | Borrower | Loan Amount |
|---|---|---|---|
| Previous Owner | Stemen Dennis M | $100,000 |
Source: Public Records
Tax History Compared to Growth
Tax History
| Year | Tax Paid | Tax Assessment Tax Assessment Total Assessment is a certain percentage of the fair market value that is determined by local assessors to be the total taxable value of land and additions on the property. | Land | Improvement |
|---|---|---|---|---|
| 2024 | $1,720 | $55,790 | $10,360 | $45,430 |
| 2023 | $1,356 | $41,660 | $7,740 | $33,920 |
| 2022 | $1,335 | $40,010 | $7,740 | $32,270 |
| 2021 | $1,343 | $40,010 | $7,740 | $32,270 |
| 2020 | $1,112 | $34,730 | $7,390 | $27,340 |
| 2019 | $1,112 | $34,730 | $7,390 | $27,340 |
| 2018 | $1,095 | $34,730 | $7,390 | $27,340 |
| 2017 | $1,050 | $32,240 | $7,390 | $24,850 |
| 2016 | $1,063 | $32,240 | $7,390 | $24,850 |
| 2015 | $1,054 | $32,240 | $7,390 | $24,850 |
| 2014 | $1,054 | $31,890 | $7,110 | $24,780 |
| 2013 | $1,059 | $31,890 | $7,110 | $24,780 |
Source: Public Records
Map
Nearby Homes
- 821 E 3rd St
- 914 E 3rd St
- 633 E 2nd St
- 650 E 6th St
- 702 Jackson St
- 804 N Moening St
- 628 N Pierce St
- 405 N Franklin St
- 310 S Pierce St
- 210 E 3rd St
- 704 N Franklin St
- 221 S Main St
- 424 S Canal St
- 1035 N Main St
- 7110 Elida Rd
- 404 W 5th St
- 827 S Washington St
- 409 N Bredeick St
- 634 S Clay St
- 604 W 6th St