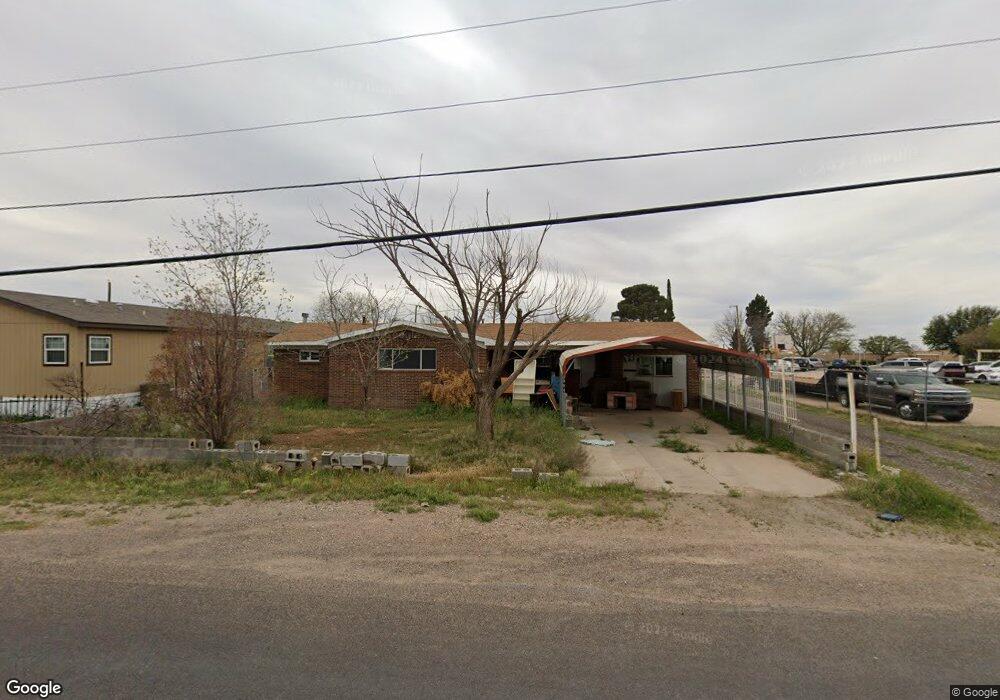
904 E Hillmont Rd Odessa, TX 79765
Estimated Value: $192,000 - $263,000
3
Beds
2
Baths
1,499
Sq Ft
$149/Sq Ft
Est. Value
About This Home
This home is located at 904 E Hillmont Rd, Odessa, TX 79765 and is currently estimated at $223,579, approximately $149 per square foot. 904 E Hillmont Rd is a home located in Ector County with nearby schools including Lee Buice Elementary School, Wilson & Young Medal of Honor Middle School, and Permian High School.
Ownership History
Date
Name
Owned For
Owner Type
Purchase Details
Closed on
Mar 21, 2025
Sold by
Sis Michael J
Bought by
Od-Hr
Current Estimated Value
Purchase Details
Closed on
Aug 30, 2024
Sold by
Murillo Sonia and Rodriguez Christopher B
Bought by
Most Reverend Michael J Sis Bishop Of The Rom
Purchase Details
Closed on
May 24, 2022
Sold by
Elia Lima Rosa
Bought by
Lima Rosa Elia and Murillo Sonia
Purchase Details
Closed on
May 23, 2022
Sold by
Elia Lima Rosa
Bought by
Lima Rosa Elia and Murillo Sonia
Purchase Details
Closed on
Jan 17, 2005
Sold by
Swartz & Brough Inc
Bought by
Murillo Sonia and Rodriguez Antonia
Home Financials for this Owner
Home Financials are based on the most recent Mortgage that was taken out on this home.
Original Mortgage
$29,000
Interest Rate
5.8%
Mortgage Type
Seller Take Back
Create a Home Valuation Report for This Property
The Home Valuation Report is an in-depth analysis detailing your home's value as well as a comparison with similar homes in the area
Home Values in the Area
Average Home Value in this Area
Purchase History
| Date | Buyer | Sale Price | Title Company |
|---|---|---|---|
| Od-Hr | -- | None Listed On Document | |
| Most Reverend Michael J Sis Bishop Of The Rom | -- | None Listed On Document | |
| Lima Rosa Elia | -- | None Listed On Document | |
| Lima Rosa Elia | -- | None Listed On Document | |
| Murillo Sonia | -- | None Available |
Source: Public Records
Mortgage History
| Date | Status | Borrower | Loan Amount |
|---|---|---|---|
| Previous Owner | Murillo Sonia | $29,000 |
Source: Public Records
Tax History Compared to Growth
Tax History
| Year | Tax Paid | Tax Assessment Tax Assessment Total Assessment is a certain percentage of the fair market value that is determined by local assessors to be the total taxable value of land and additions on the property. | Land | Improvement |
|---|---|---|---|---|
| 2024 | $1,721 | $104,836 | $10,608 | $94,228 |
| 2023 | $1,631 | $100,427 | $10,608 | $89,819 |
| 2022 | $1,740 | $95,280 | $10,608 | $84,672 |
| 2021 | $1,732 | $92,043 | $10,608 | $81,435 |
| 2020 | $1,588 | $86,191 | $10,608 | $75,583 |
| 2019 | $1,726 | $95,264 | $10,608 | $84,656 |
| 2018 | $1,469 | $86,728 | $10,608 | $76,120 |
| 2017 | $1,296 | $71,738 | $858 | $70,880 |
| 2016 | $1,255 | $71,738 | $858 | $70,880 |
| 2015 | $332 | $71,738 | $858 | $70,880 |
| 2014 | $332 | $68,043 | $858 | $67,185 |
Source: Public Records
Map
Nearby Homes
- 903 E Hillmont Rd
- 906 E Hillmont Rd
- 908 E Hillmont Rd
- 1831 E 87th St Unit 105
- 1831 E 87th St Unit 104
- 1801 E 87th St
- 919 Edgeport Dr
- 901 E Hillmont Rd
- 911 E Hillmont Rd
- 921 Edgeport Dr
- 910 E Hillmont Rd
- 915 E Hillmont Rd
- 916 Yellowstone Dr
- 918 Edgeport Dr
- 910 Edgeport Dr
- 903 Yucca Ave
- 914 Edgeport Dr
- 912 E Hillmont Rd
- 918 Yellowstone Dr
- 918 Yellowstone Dr