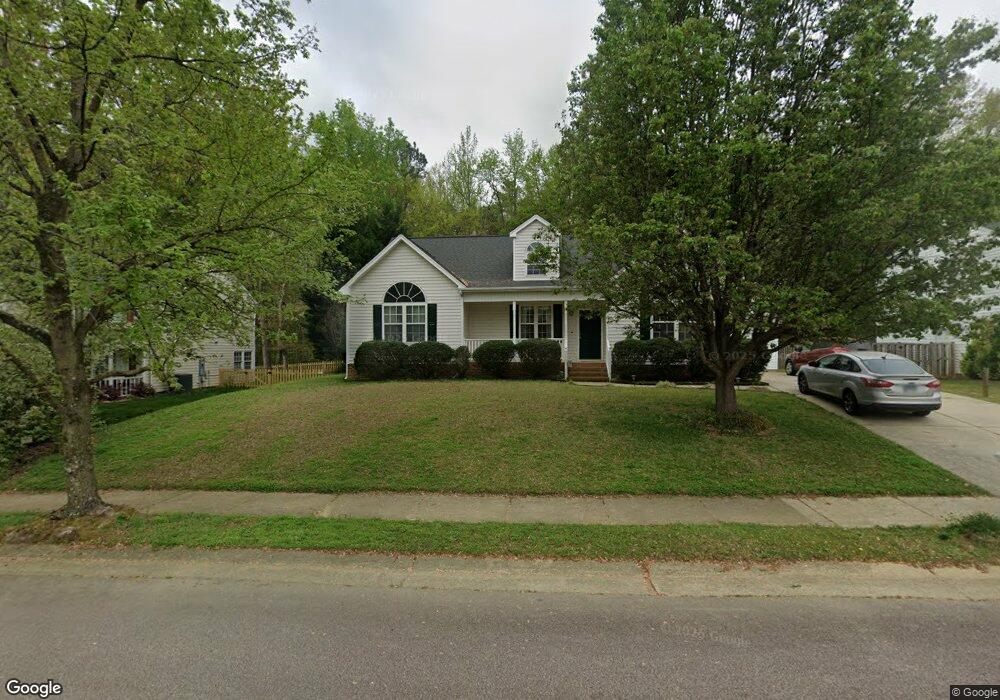
904 Earp St Holly Springs, NC 27540
Estimated Value: $419,887 - $450,000
3
Beds
2
Baths
1,704
Sq Ft
$256/Sq Ft
Est. Value
About This Home
This home is located at 904 Earp St, Holly Springs, NC 27540 and is currently estimated at $436,222, approximately $255 per square foot. 904 Earp St is a home located in Wake County with nearby schools including Holly Ridge Elementary School, Holly Ridge Middle School, and Holly Springs High School.
Ownership History
Date
Name
Owned For
Owner Type
Purchase Details
Closed on
May 25, 2022
Sold by
Anibal Zu and Anibal Orestes
Bought by
Zu-Macchione Living Trust
Current Estimated Value
Purchase Details
Closed on
Jun 14, 2017
Sold by
Perrigo Wade M
Bought by
Zu Dandan and Macchione Orestes Anibal
Purchase Details
Closed on
Jun 21, 2010
Sold by
Stec Charles James and Stec Angeles Salas
Bought by
Perrigo Wade M
Home Financials for this Owner
Home Financials are based on the most recent Mortgage that was taken out on this home.
Original Mortgage
$176,621
Interest Rate
3.62%
Mortgage Type
FHA
Purchase Details
Closed on
Oct 27, 2006
Sold by
Gregory Sherry L
Bought by
Stec Charles James and Stec Angeles Salas
Purchase Details
Closed on
Sep 30, 1999
Sold by
Stephenson Timmy L
Bought by
Gregory Sherry L
Home Financials for this Owner
Home Financials are based on the most recent Mortgage that was taken out on this home.
Original Mortgage
$142,650
Interest Rate
7.37%
Create a Home Valuation Report for This Property
The Home Valuation Report is an in-depth analysis detailing your home's value as well as a comparison with similar homes in the area
Home Values in the Area
Average Home Value in this Area
Purchase History
| Date | Buyer | Sale Price | Title Company |
|---|---|---|---|
| Zu-Macchione Living Trust | -- | Corbett Kellie M | |
| Zu-Macchione Living Trust | -- | None Listed On Document | |
| Zu Dandan | $240,000 | None Available | |
| Perrigo Wade M | $179,000 | None Available | |
| Stec Charles James | $164,000 | None Available | |
| Gregory Sherry L | $158,500 | -- |
Source: Public Records
Mortgage History
| Date | Status | Borrower | Loan Amount |
|---|---|---|---|
| Previous Owner | Perrigo Wade M | $176,621 | |
| Previous Owner | Gregory Sherry L | $142,650 |
Source: Public Records
Tax History Compared to Growth
Tax History
| Year | Tax Paid | Tax Assessment Tax Assessment Total Assessment is a certain percentage of the fair market value that is determined by local assessors to be the total taxable value of land and additions on the property. | Land | Improvement |
|---|---|---|---|---|
| 2025 | -- | $413,605 | $120,000 | $293,605 |
| 2024 | $3,565 | $413,605 | $120,000 | $293,605 |
| 2023 | $2,702 | $248,666 | $65,000 | $183,666 |
| 2022 | $2,609 | $248,666 | $65,000 | $183,666 |
| 2021 | $2,560 | $248,666 | $65,000 | $183,666 |
| 2020 | $2,560 | $248,666 | $65,000 | $183,666 |
| 2019 | $2,342 | $192,947 | $55,000 | $137,947 |
| 2018 | $0 | $192,947 | $55,000 | $137,947 |
| 2017 | $2,041 | $192,947 | $55,000 | $137,947 |
| 2016 | $2,013 | $192,947 | $55,000 | $137,947 |
| 2015 | $1,872 | $176,443 | $45,000 | $131,443 |
| 2014 | -- | $176,443 | $45,000 | $131,443 |
Source: Public Records
Map
Nearby Homes
- 208 Old Ride Dr
- 225 Old Ride Dr
- 217 Jones Hill Rd
- 413 Rhamkatte Rd
- 109 Lacombe Ct
- 0 Old Ride Dr
- 228 Masden Rd
- 116 Cabrita Ct
- 0/416 Holly Springs Rd
- 504 Prince Dr
- 112 Midden Way
- 705 Morton Farm Rd
- 404 Prince Dr
- 5200 Gable Ridge Ln
- 401 Vista Springs Cir
- 204 Chrismill Ln
- 215 Savannah Ridge Rd Unit 215
- 421 Grigsby Ave
- 305 Savannah Ridge Rd
- 204 Crossway Ln
- 908 Earp St
- 900 Earp St
- 100 Holly Bay Ln
- 912 Earp St
- 808 Earp St
- 101 Holly Bay Ln
- 104 Holly Bay Ln
- 1000 Earp St
- 204 Grassy Meadow Rd
- 105 Holly Bay Ln
- 108 Holly Bay Ln
- 205 Grassy Meadow Rd
- 1004 Earp St
- 200 Grassy Meadow Rd
- 109 Holly Bay Ln
- 121 Flatrock Ln
- 100 Red Holly Ln
- 1005 Earp St
- 104 Camelback Dr
- 112 Holly Bay Ln