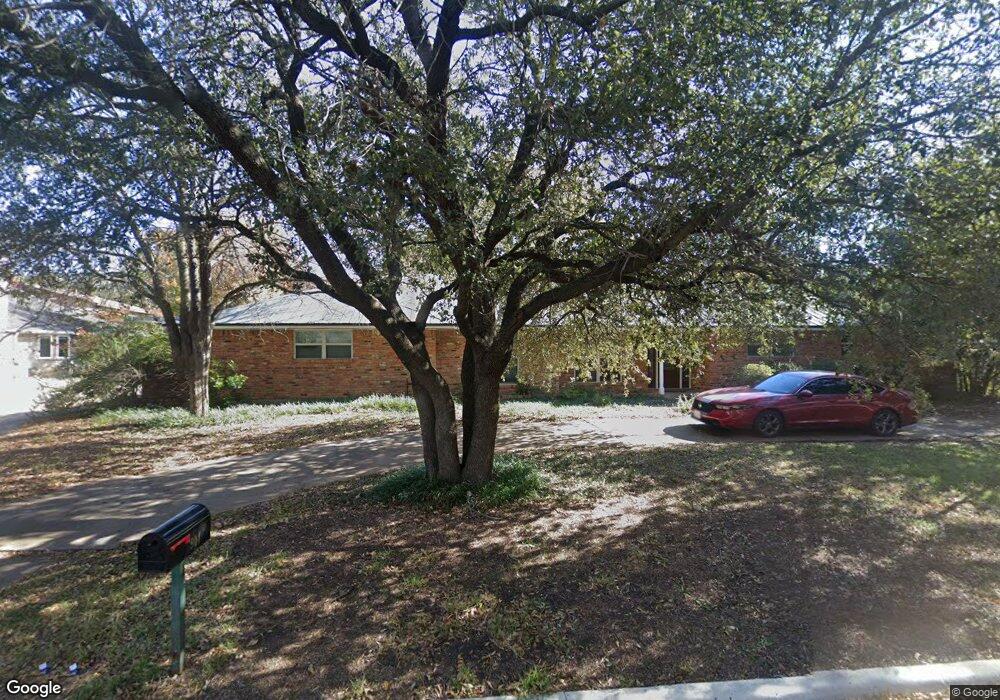
904 Edgecliff Dr Bedford, TX 76022
Estimated Value: $472,831 - $543,000
4
Beds
4
Baths
3,128
Sq Ft
$157/Sq Ft
Est. Value
About This Home
This home is located at 904 Edgecliff Dr, Bedford, TX 76022 and is currently estimated at $491,958, approximately $157 per square foot. 904 Edgecliff Dr is a home located in Tarrant County with nearby schools including Stonegate Elementary School, Central J High School, and L.D. Bell High School.
Ownership History
Date
Name
Owned For
Owner Type
Purchase Details
Closed on
Nov 14, 2011
Sold by
Jourde Austin and Jourde Maia
Bought by
Mitchell Ann L and Mitchell Cary A
Current Estimated Value
Home Financials for this Owner
Home Financials are based on the most recent Mortgage that was taken out on this home.
Original Mortgage
$278,000
Outstanding Balance
$189,294
Interest Rate
3.99%
Mortgage Type
Purchase Money Mortgage
Estimated Equity
$302,664
Purchase Details
Closed on
Apr 12, 2001
Sold by
Wright H B H and Wright Joan
Bought by
Joude Austin and Jourde Maia
Home Financials for this Owner
Home Financials are based on the most recent Mortgage that was taken out on this home.
Original Mortgage
$116,000
Interest Rate
6.81%
Purchase Details
Closed on
Jun 28, 1999
Sold by
Bass Anna L
Bought by
Wright H B H and Wright Joan
Create a Home Valuation Report for This Property
The Home Valuation Report is an in-depth analysis detailing your home's value as well as a comparison with similar homes in the area
Home Values in the Area
Average Home Value in this Area
Purchase History
| Date | Buyer | Sale Price | Title Company |
|---|---|---|---|
| Mitchell Ann L | -- | Rtt | |
| Joude Austin | -- | Southwest Land Title | |
| Wright H B H | -- | Alamo Title Company |
Source: Public Records
Mortgage History
| Date | Status | Borrower | Loan Amount |
|---|---|---|---|
| Open | Mitchell Ann L | $278,000 | |
| Previous Owner | Joude Austin | $116,000 |
Source: Public Records
Tax History Compared to Growth
Tax History
| Year | Tax Paid | Tax Assessment Tax Assessment Total Assessment is a certain percentage of the fair market value that is determined by local assessors to be the total taxable value of land and additions on the property. | Land | Improvement |
|---|---|---|---|---|
| 2025 | $2,122 | $341,260 | $90,000 | $251,260 |
| 2024 | $2,122 | $341,260 | $90,000 | $251,260 |
| 2023 | $6,308 | $343,472 | $65,000 | $278,472 |
| 2022 | $6,530 | $311,218 | $65,000 | $246,218 |
| 2021 | $6,403 | $271,808 | $65,000 | $206,808 |
| 2020 | $7,418 | $311,989 | $65,000 | $246,989 |
| 2019 | $7,032 | $291,451 | $65,000 | $226,451 |
| 2018 | $3,759 | $263,126 | $35,000 | $228,126 |
| 2017 | $5,787 | $239,205 | $35,000 | $204,205 |
| 2016 | $5,350 | $221,138 | $35,000 | $186,138 |
| 2015 | $3,775 | $207,800 | $24,000 | $183,800 |
| 2014 | $3,775 | $207,800 | $24,000 | $183,800 |
Source: Public Records
Map
Nearby Homes
- 909 Overhill Dr
- 921 Overhill Dr
- 1004 Overhill Dr
- 1031 Boston Blvd
- 904 Nelson Terrace
- 1204 Edgecliff Dr
- 832 Chateau Valee Cir
- 933 Wade Dr
- 1108 Wade Dr
- 1213 Briar Dr
- 604 Donna Ln
- 1200 Tanglewood Trail
- 501 Merrill Dr
- 1701 Winchester Way
- 1604 Richmond Dr
- 1613 Trinity Ct
- 849 Russell Ln
- 1008 Russell Ln
- 1309 Driftwood Dr
- 1509 Shirley Way
- 900 Edgecliff Dr
- 908 Edgecliff Dr
- 905 Overhill Dr
- 901 Overhill Dr
- 912 Edgecliff Dr
- 913 Edgecliff Dr
- 816 Rankin Dr
- 913 Overhill Dr
- 901 Edgecliff Dr
- 812 Rankin Dr
- 820 Rankin Dr
- 917 Edgecliff Dr
- 808 Rankin Dr
- 916 Edgecliff Dr
- 917 Overhill Dr
- 904 Overhill Dr
- 901 Rankin Dr
- 900 Rankin Dr
- 37 Linderhof Cir
- 804 Rankin Dr