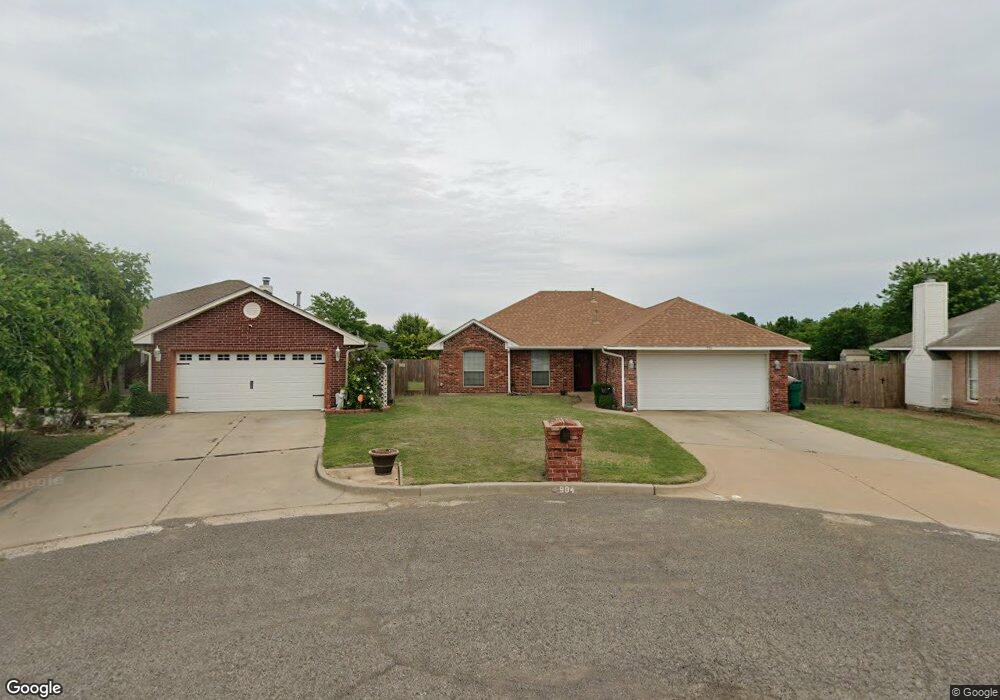
904 Exter Cir Yukon, OK 73099
Westbury NeighborhoodEstimated Value: $212,000 - $222,000
3
Beds
2
Baths
1,450
Sq Ft
$150/Sq Ft
Est. Value
About This Home
This home is located at 904 Exter Cir, Yukon, OK 73099 and is currently estimated at $217,882, approximately $150 per square foot. 904 Exter Cir is a home located in Canadian County with nearby schools including Mustang Creek Elementary School, Canyon Ridge Intermediate School, and Mustang North Middle School.
Ownership History
Date
Name
Owned For
Owner Type
Purchase Details
Closed on
Dec 2, 2002
Sold by
Burke Brothers Llc
Bought by
Breasette Floyd and Breasette Shelia
Current Estimated Value
Home Financials for this Owner
Home Financials are based on the most recent Mortgage that was taken out on this home.
Original Mortgage
$105,624
Outstanding Balance
$45,501
Interest Rate
6.28%
Estimated Equity
$172,381
Purchase Details
Closed on
May 31, 2002
Sold by
Vistas Development Llc
Home Financials for this Owner
Home Financials are based on the most recent Mortgage that was taken out on this home.
Original Mortgage
$88,300
Interest Rate
6.92%
Purchase Details
Closed on
Feb 13, 2002
Sold by
Westbury Investors Llc
Purchase Details
Closed on
Jun 19, 1996
Sold by
Sw Title & Trust Co Trustee
Purchase Details
Closed on
Dec 20, 1994
Sold by
Westbury Dev Corp Llc
Purchase Details
Closed on
Nov 19, 1993
Sold by
Westbury Dev Corp
Create a Home Valuation Report for This Property
The Home Valuation Report is an in-depth analysis detailing your home's value as well as a comparison with similar homes in the area
Home Values in the Area
Average Home Value in this Area
Purchase History
| Date | Buyer | Sale Price | Title Company |
|---|---|---|---|
| Breasette Floyd | $108,500 | -- | |
| -- | $16,500 | -- | |
| -- | $390,000 | -- | |
| -- | $270,000 | -- | |
| -- | -- | -- | |
| -- | -- | -- |
Source: Public Records
Mortgage History
| Date | Status | Borrower | Loan Amount |
|---|---|---|---|
| Open | Breasette Floyd | $105,624 | |
| Previous Owner | -- | $88,300 |
Source: Public Records
Tax History Compared to Growth
Tax History
| Year | Tax Paid | Tax Assessment Tax Assessment Total Assessment is a certain percentage of the fair market value that is determined by local assessors to be the total taxable value of land and additions on the property. | Land | Improvement |
|---|---|---|---|---|
| 2024 | $1,776 | $17,184 | $1,980 | $15,204 |
| 2023 | $1,776 | $16,683 | $1,980 | $14,703 |
| 2022 | $1,747 | $16,197 | $1,980 | $14,217 |
| 2021 | $1,778 | $16,523 | $1,980 | $14,543 |
| 2020 | $1,815 | $16,686 | $1,980 | $14,706 |
| 2019 | $1,789 | $16,481 | $1,980 | $14,501 |
| 2018 | $1,766 | $16,001 | $1,980 | $14,021 |
| 2017 | $1,701 | $15,636 | $1,980 | $13,656 |
| 2016 | $1,643 | $15,636 | $1,980 | $13,656 |
| 2015 | $1,560 | $14,738 | $1,980 | $12,758 |
| 2014 | $1,560 | $14,360 | $1,980 | $12,380 |
Source: Public Records
Map
Nearby Homes
- 10041 Aberdeen Ln
- 10210 Exter Ave
- 10321 Exter Ave
- 10340 Exter Ave
- 10428 Fairfax Ln
- 10412 Dover Dr
- 10509 Aberdeen Dr
- 1417 Mayer Dr
- 10001 Hollyhead Way
- 10329 Kendal Ave
- 1813 Bonnycastle Ln
- 9716 Blue Bonnet Place
- 11805 Edi Ave
- 9936 Birkenhead Ct
- 10037 Saint Helens Dr
- 2105 Bonnycastle Ln
- 10116 Thompson Ave
- 1701 Everglade Ct
- 2138 Edinburg Dr
- 9620 Gold Field Place
- 900 Exter Cir
- 908 Exter Cir
- 10213 Cardiff Cir
- 912 Exter Cir
- 10208 Cardiff Cir
- 10205 Banff Way
- 901 Exter Cir
- 10209 Cardiff Cir
- 10201 Banff Way
- 10216 Aberdeen Dr
- 905 Exter Cir
- 909 Exter Cir
- 10220 Aberdeen Dr
- 913 Exter Cir
- 10212 Aberdeen Dr
- 10205 Cardiff Cir
- 10224 Aberdeen Dr
- 10121 Banff Way
- 10208 Aberdeen Dr
- 917 Exter Cir