904 Fulton St Falls City, NE 68355
Estimated Value: $55,000 - $76,000
2
Beds
1
Bath
1,253
Sq Ft
$50/Sq Ft
Est. Value
About This Home
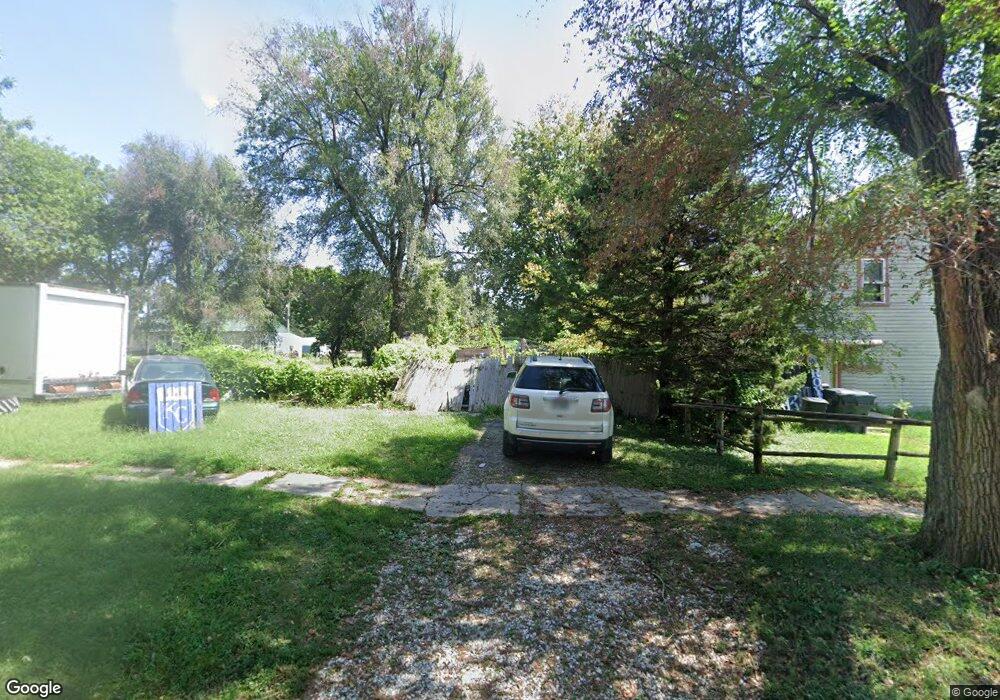
This home is located at 904 Fulton St, Falls City, NE 68355 and is currently estimated at $62,287, approximately $49 per square foot. 904 Fulton St is a home located in Richardson County with nearby schools including Falls City North Elementary School, Falls City South Elementary School, and Falls City Middle School.
Ownership History
Date
Name
Owned For
Owner Type
Purchase Details
Closed on
Sep 29, 2010
Sold by
Genovese Dino S and Genovese Dino
Bought by
Genovese Kelly J
Current Estimated Value
Purchase Details
Closed on
May 1, 2002
Sold by
Dewald William O and Dewald Lina C
Bought by
Genovese Dino S and Genovese Kelly J
Purchase Details
Closed on
Sep 11, 2001
Sold by
Shefferd Gary W
Bought by
Dewald William O and Dewald Lina C
Purchase Details
Closed on
May 2, 2000
Sold by
Shefferd Leonard
Bought by
Shefferd Gary W
Create a Home Valuation Report for This Property
The Home Valuation Report is an in-depth analysis detailing your home's value as well as a comparison with similar homes in the area
Home Values in the Area
Average Home Value in this Area
Purchase History
| Date | Buyer | Sale Price | Title Company |
|---|---|---|---|
| Genovese Kelly J | -- | -- | |
| Genovese Dino S | $15,000 | -- | |
| Dewald William O | $15,000 | -- | |
| Shefferd Gary W | -- | -- |
Source: Public Records
Tax History Compared to Growth
Tax History
| Year | Tax Paid | Tax Assessment Tax Assessment Total Assessment is a certain percentage of the fair market value that is determined by local assessors to be the total taxable value of land and additions on the property. | Land | Improvement |
|---|---|---|---|---|
| 2025 | $279 | $23,223 | $3,300 | $19,923 |
| 2024 | $279 | $22,095 | $3,300 | $18,795 |
| 2023 | $247 | $15,052 | $3,300 | $11,752 |
| 2022 | $255 | $13,284 | $1,944 | $11,340 |
| 2021 | $264 | $14,078 | $1,944 | $12,134 |
| 2020 | $256 | $13,500 | $1,944 | $11,556 |
| 2019 | $253 | $13,163 | $1,944 | $11,219 |
| 2018 | $249 | $12,836 | $1,944 | $10,892 |
| 2017 | $250 | $12,836 | $1,944 | $10,892 |
| 2016 | $242 | $12,519 | $1,944 | $10,575 |
| 2015 | $243 | $12,519 | $1,944 | $10,575 |
| 2014 | $243 | $12,519 | $1,944 | $10,575 |
Source: Public Records
Map
Nearby Homes