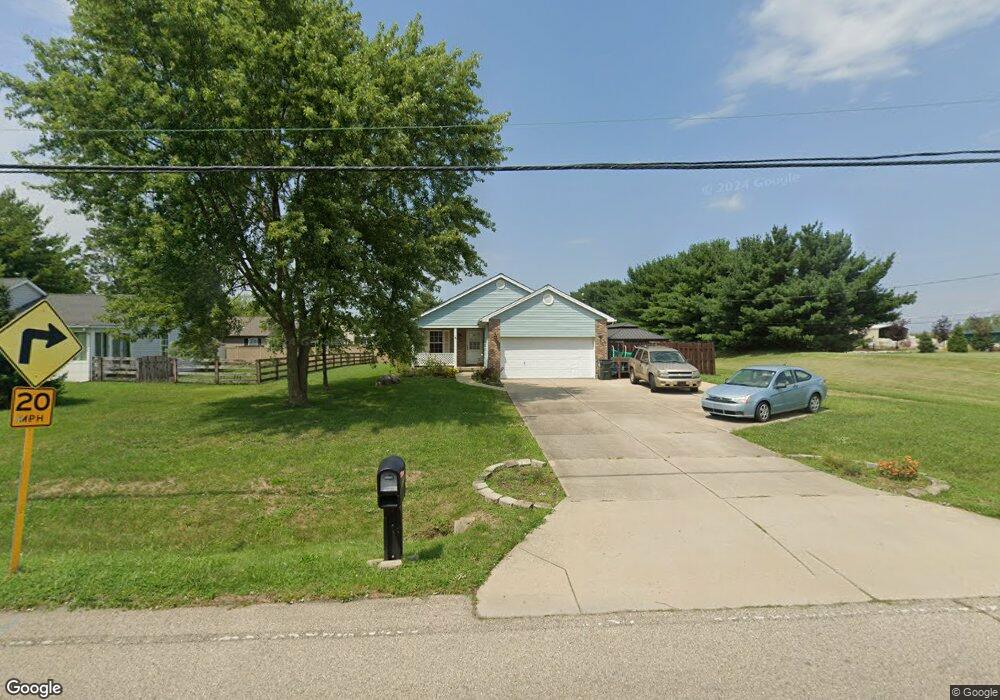
904 Garver Rd Monroe, OH 45044
Turtlecreek Township NeighborhoodEstimated Value: $238,000 - $277,370
3
Beds
2
Baths
1,244
Sq Ft
$205/Sq Ft
Est. Value
About This Home
This home is located at 904 Garver Rd, Monroe, OH 45044 and is currently estimated at $255,457, approximately $205 per square foot. 904 Garver Rd is a home located in Warren County with nearby schools including Monroe Primary School, Monroe Elementary School, and Monroe Junior High School.
Ownership History
Date
Name
Owned For
Owner Type
Purchase Details
Closed on
Dec 20, 2018
Sold by
Duncil David L
Bought by
Duncil David L and Duncil Tonya L
Current Estimated Value
Purchase Details
Closed on
May 6, 1998
Sold by
Dalton James E
Bought by
Duncil David L
Home Financials for this Owner
Home Financials are based on the most recent Mortgage that was taken out on this home.
Original Mortgage
$98,415
Outstanding Balance
$19,397
Interest Rate
7.2%
Mortgage Type
FHA
Estimated Equity
$236,060
Purchase Details
Closed on
Jun 27, 1994
Sold by
William L Brown Trst
Bought by
Dalton James E and Dalton Mitzi E
Home Financials for this Owner
Home Financials are based on the most recent Mortgage that was taken out on this home.
Original Mortgage
$88,088
Interest Rate
8.78%
Mortgage Type
FHA
Purchase Details
Closed on
Oct 26, 1993
Sold by
Steve Posey Racing Co
Bought by
Brown & William L Trustee
Purchase Details
Closed on
Sep 5, 1990
Sold by
Steve Posey Racing Co
Bought by
Steve Posey Racing Co
Create a Home Valuation Report for This Property
The Home Valuation Report is an in-depth analysis detailing your home's value as well as a comparison with similar homes in the area
Home Values in the Area
Average Home Value in this Area
Purchase History
| Date | Buyer | Sale Price | Title Company |
|---|---|---|---|
| Duncil David L | -- | None Available | |
| Duncil David L | $98,500 | -- | |
| Dalton James E | $89,240 | -- | |
| Brown & William L Trustee | $2,600 | -- | |
| Steve Posey Racing Co | -- | -- |
Source: Public Records
Mortgage History
| Date | Status | Borrower | Loan Amount |
|---|---|---|---|
| Open | Duncil David L | $98,415 | |
| Previous Owner | Dalton James E | $88,088 |
Source: Public Records
Tax History Compared to Growth
Tax History
| Year | Tax Paid | Tax Assessment Tax Assessment Total Assessment is a certain percentage of the fair market value that is determined by local assessors to be the total taxable value of land and additions on the property. | Land | Improvement |
|---|---|---|---|---|
| 2024 | $2,951 | $67,110 | $19,250 | $47,860 |
| 2023 | $2,372 | $53,207 | $10,762 | $42,444 |
| 2022 | $2,551 | $53,207 | $10,763 | $42,445 |
| 2021 | $2,367 | $53,207 | $10,763 | $42,445 |
| 2020 | $2,104 | $43,257 | $8,750 | $34,507 |
| 2019 | $2,225 | $43,257 | $8,750 | $34,507 |
| 2018 | $2,229 | $43,257 | $8,750 | $34,507 |
| 2017 | $2,043 | $38,465 | $7,147 | $31,318 |
| 2016 | $2,158 | $38,465 | $7,147 | $31,318 |
| 2015 | $2,141 | $38,465 | $7,147 | $31,318 |
| 2014 | $2,094 | $38,470 | $7,150 | $31,320 |
| 2013 | $2,128 | $47,080 | $8,750 | $38,330 |
Source: Public Records
Map
Nearby Homes
- 995 N Garver Rd
- 0 Greentree Rd Unit 934072
- 1116 N Main St
- Lot 2 Greentree Rd
- 6935 Gaspar Trail
- CRESTWOOD Plan at Caravel
- KENDALL Plan at Caravel
- SEBASTIAN Plan at Caravel
- ALDRIDGE Plan at Caravel
- BRENNAN Plan at Caravel
- BENNETT Plan at Caravel
- ASH LAWN Plan at Caravel
- VANDERBURGH Plan at Caravel
- LYNDHURST Plan at Caravel
- Lot 3 Greentree Rd
- 404 Brookhurst Dr
- 44 Ridge Wood Dr
- 142 Village Ct
- 46 Ridge Wood Dr
- 195 Brittony Woods Dr
- 920 Garver Rd
- 918 Garver Rd
- 916 Garver Rd
- 912 Garver Rd
- 910 Garver Rd
- 908 Garver Rd
- 906 Garver Rd
- 918 Garver Rd
- 890 N Garver Rd
- 0 N Garver Rd Unit 1373463
- 0 N Garver Rd Unit 1444287
- 906 N Garver Rd
- 1.2106ac N Garver Rd
- 910 N Garver Rd
- 1001 Baker Dr
- 907 Garver Rd
- 912 N Garver Rd
- 901 Garver Rd
- 924 N Garver Rd
- 914 Garver Rd