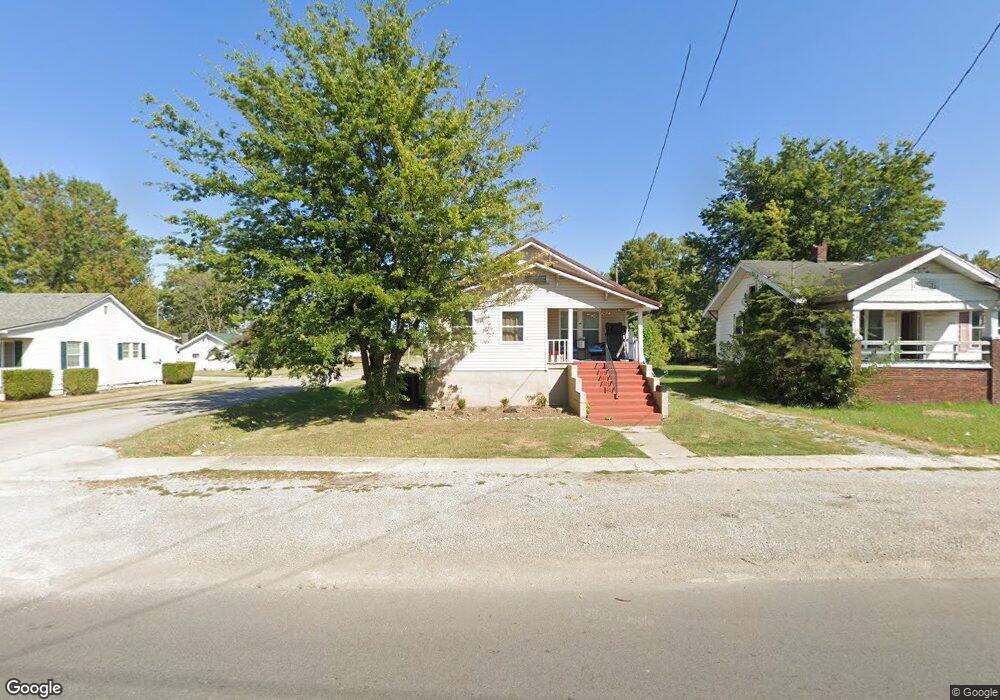
904 N Main St Harrisburg, IL 62946
Estimated Value: $73,000 - $83,000
3
Beds
2
Baths
1,086
Sq Ft
$72/Sq Ft
Est. Value
About This Home
This home is located at 904 N Main St, Harrisburg, IL 62946 and is currently estimated at $77,745, approximately $71 per square foot. 904 N Main St is a home located in Saline County with nearby schools including East Side Intermediate School, Harrisburg Middle School, and Harrisburg High School.
Ownership History
Date
Name
Owned For
Owner Type
Purchase Details
Closed on
May 17, 2021
Sold by
Shaw Aaron and Shaw Lara
Bought by
Jackson Hunter Drake
Current Estimated Value
Home Financials for this Owner
Home Financials are based on the most recent Mortgage that was taken out on this home.
Original Mortgage
$45,600
Outstanding Balance
$41,082
Interest Rate
3%
Mortgage Type
New Conventional
Estimated Equity
$36,663
Purchase Details
Closed on
Sep 27, 2017
Sold by
Toothman Aaron
Bought by
Shaw Aaron and Shaw Lara
Purchase Details
Closed on
Apr 29, 2016
Sold by
Dowdy Bradley Joe
Bought by
Toothman Aaron
Create a Home Valuation Report for This Property
The Home Valuation Report is an in-depth analysis detailing your home's value as well as a comparison with similar homes in the area
Home Values in the Area
Average Home Value in this Area
Purchase History
| Date | Buyer | Sale Price | Title Company |
|---|---|---|---|
| Jackson Hunter Drake | $57,000 | Accommodation | |
| Shaw Aaron | $20,000 | Attorney | |
| Toothman Aaron | -- | None Available |
Source: Public Records
Mortgage History
| Date | Status | Borrower | Loan Amount |
|---|---|---|---|
| Open | Jackson Hunter Drake | $45,600 |
Source: Public Records
Tax History Compared to Growth
Tax History
| Year | Tax Paid | Tax Assessment Tax Assessment Total Assessment is a certain percentage of the fair market value that is determined by local assessors to be the total taxable value of land and additions on the property. | Land | Improvement |
|---|---|---|---|---|
| 2024 | $2,191 | $24,475 | $1,614 | $22,861 |
| 2023 | $2,049 | $20,745 | $1,368 | $19,377 |
| 2022 | $2,020 | $19,556 | $1,290 | $18,266 |
| 2021 | $1,247 | $12,026 | $1,330 | $10,696 |
| 2020 | $1,233 | $11,665 | $1,290 | $10,375 |
| 2019 | $1,256 | $11,665 | $1,290 | $10,375 |
| 2018 | $1,270 | $11,665 | $1,290 | $10,375 |
| 2017 | $1,072 | $16,000 | $1,290 | $14,710 |
| 2016 | $11 | $16,000 | $1,290 | $14,710 |
| 2015 | -- | $16,000 | $1,290 | $14,710 |
| 2014 | $568 | $16,000 | $1,290 | $14,710 |
| 2013 | $568 | $16,000 | $1,290 | $14,710 |
| 2012 | $568 | $11,965 | $1,290 | $10,675 |
Source: Public Records
Map
Nearby Homes
- 111 W Midkiff St
- 0 Ron Crank Dr Unit EB441387
- 202 W Poplar St
- 216 W Poplar St
- 311 W Poplar St
- 18 S Mill St
- 204 N Sherman St
- 305 W Church St
- 430 W Church St
- 215 S Jackson St
- 210 W Lincoln St
- 504 W South St
- 305 W Lincoln St
- 630 N Commercial St
- 206 W Homer Ave
- 1120 Dorris Heights Rd
- 127 W Homer Ave
- 333 E Sloan St
- 520 S Mckinley St
- 200 Ogara St