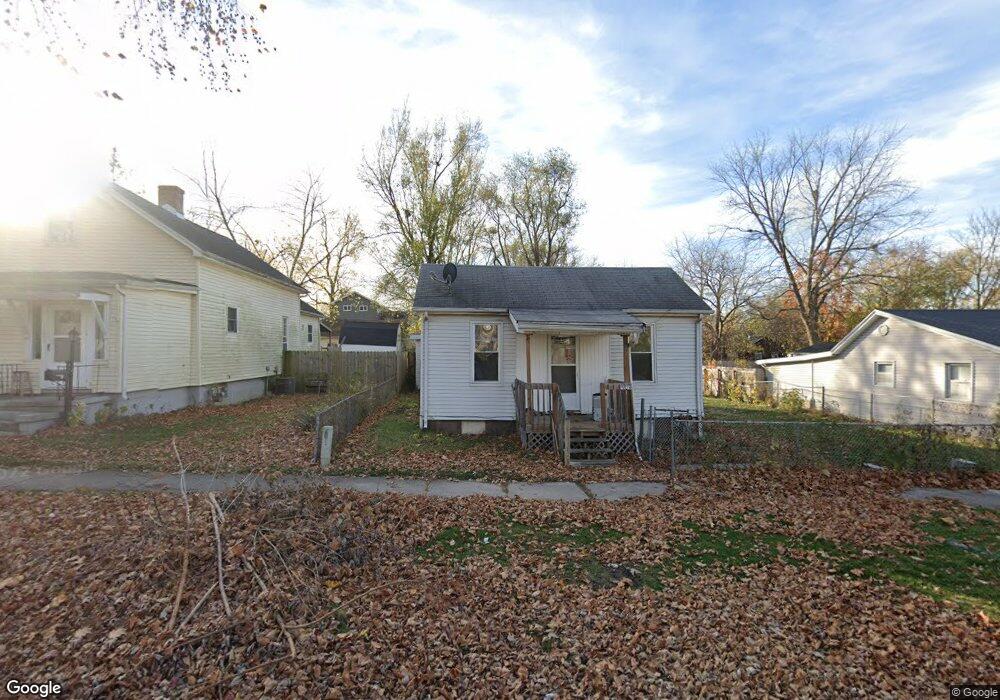
904 N Morris Ave Bloomington, IL 61701
Estimated Value: $76,000 - $154,000
--
Bed
--
Bath
1,119
Sq Ft
$94/Sq Ft
Est. Value
About This Home
This home is located at 904 N Morris Ave, Bloomington, IL 61701 and is currently estimated at $105,640, approximately $94 per square foot. 904 N Morris Ave is a home located in McLean County with nearby schools including Sheridan Elementary School, Bloomington Junior High School, and Bloomington High School.
Ownership History
Date
Name
Owned For
Owner Type
Purchase Details
Closed on
Oct 30, 2023
Sold by
Edward J Carroll Revocable Living Trust
Bought by
Carroll Daniel J
Current Estimated Value
Home Financials for this Owner
Home Financials are based on the most recent Mortgage that was taken out on this home.
Original Mortgage
$62,371
Outstanding Balance
$61,283
Interest Rate
7.5%
Mortgage Type
New Conventional
Estimated Equity
$44,357
Purchase Details
Closed on
Sep 5, 2007
Sold by
Prairie State Properties Llc
Bought by
Carroll Edward J
Purchase Details
Closed on
Aug 27, 2007
Sold by
Milton Peggy Ann
Bought by
Prairie State Properties Llc
Create a Home Valuation Report for This Property
The Home Valuation Report is an in-depth analysis detailing your home's value as well as a comparison with similar homes in the area
Home Values in the Area
Average Home Value in this Area
Purchase History
| Date | Buyer | Sale Price | Title Company |
|---|---|---|---|
| Carroll Daniel J | $64,500 | Mclean County Title | |
| Carroll Edward J | $23,000 | None Available | |
| Prairie State Properties Llc | -- | None Available |
Source: Public Records
Mortgage History
| Date | Status | Borrower | Loan Amount |
|---|---|---|---|
| Open | Carroll Daniel J | $62,371 |
Source: Public Records
Tax History Compared to Growth
Tax History
| Year | Tax Paid | Tax Assessment Tax Assessment Total Assessment is a certain percentage of the fair market value that is determined by local assessors to be the total taxable value of land and additions on the property. | Land | Improvement |
|---|---|---|---|---|
| 2024 | $1,731 | $24,300 | $9,820 | $14,480 |
| 2022 | $1,731 | $20,372 | $8,233 | $12,139 |
| 2021 | $1,585 | $18,650 | $7,537 | $11,113 |
| 2020 | $1,581 | $18,650 | $7,537 | $11,113 |
| 2019 | $1,549 | $18,333 | $7,409 | $10,924 |
| 2018 | $1,900 | $22,572 | $7,193 | $15,379 |
| 2017 | $1,852 | $22,000 | $7,011 | $14,989 |
| 2016 | $813 | $9,673 | $6,440 | $3,233 |
| 2015 | $800 | $9,545 | $6,355 | $3,190 |
| 2014 | $775 | $9,545 | $6,355 | $3,190 |
| 2013 | -- | $9,891 | $6,585 | $3,306 |
Source: Public Records
Map
Nearby Homes
- 806 N Morris Ave
- 807 N Morris Ave
- 713 Ohara St
- 1216 W Market St
- 1405 W Mulberry St
- 1512 W Locust St
- 601 N Allin St
- 810 W Market St
- 809 W Monroe St
- 511 N Mason St
- 301 Stillwell St
- 1102 N Lee St
- 1001 N Lee St
- 919 N Lee St
- 1324 Ewing St
- 500 N Lee St
- 507 N Lee St
- 1102 W Front St
- 412 N Roosevelt Ave
- 913 W Grove St
- 906 N Morris Ave
- 902 N Morris Ave
- 908 N Morris Ave
- 1207 W Walnut St
- 1206 Blackstone St
- 901 N Morris Ave
- 1209 W Walnut St
- 903 N Morris Ave
- 1210 Blackstone St
- 814 N Morris Ave
- 1213 W Walnut St
- 905 N Morris Ave
- 1002 N Morris Ave
- 1103 W Walnut St
- 1208 W Walnut St
- 1215 W Walnut St
- 812 N Morris Ave
- 1001 N Morris Ave
- 809 N Morris Ave
- 1212 Blackstone St