Estimated Value: $258,000 - $302,000
4
Beds
2
Baths
2,169
Sq Ft
$132/Sq Ft
Est. Value
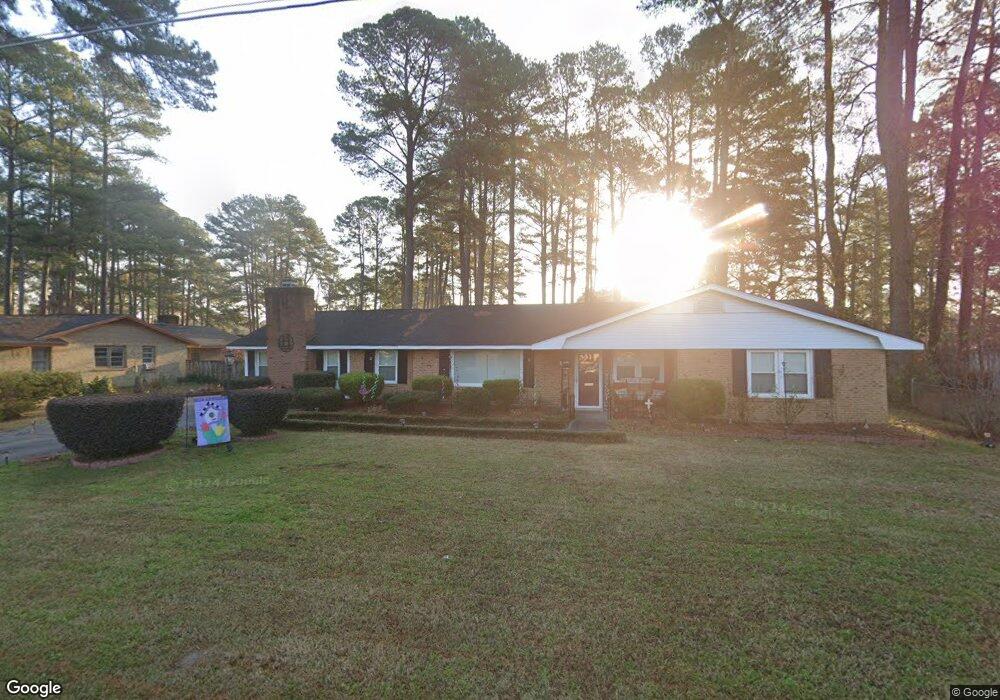
About This Home
This home is located at 904 N Sharpe St, Selma, NC 27576 and is currently estimated at $285,748, approximately $131 per square foot. 904 N Sharpe St is a home located in Johnston County with nearby schools including Selma Elementary School, Selma Middle School, and Smithfield-Selma High School.
Ownership History
Date
Name
Owned For
Owner Type
Purchase Details
Closed on
Feb 5, 2020
Sold by
Broadie Marilyn J
Bought by
Holder Larry and Holder Ada
Current Estimated Value
Home Financials for this Owner
Home Financials are based on the most recent Mortgage that was taken out on this home.
Original Mortgage
$171,830
Outstanding Balance
$153,964
Interest Rate
4.25%
Mortgage Type
FHA
Estimated Equity
$131,784
Purchase Details
Closed on
Feb 9, 2009
Sold by
Jackson Morris B and Jackson Lloyd D
Bought by
Broadie Willie and Broadie Marilyn J
Purchase Details
Closed on
Aug 17, 2006
Sold by
Town Of Apex
Bought by
Jackson Morris B
Home Financials for this Owner
Home Financials are based on the most recent Mortgage that was taken out on this home.
Original Mortgage
$100,000
Interest Rate
5.75%
Mortgage Type
Purchase Money Mortgage
Purchase Details
Closed on
Oct 17, 2001
Sold by
Town Of Apex
Bought by
Radford Bruce A
Create a Home Valuation Report for This Property
The Home Valuation Report is an in-depth analysis detailing your home's value as well as a comparison with similar homes in the area
Home Values in the Area
Average Home Value in this Area
Purchase History
| Date | Buyer | Sale Price | Title Company |
|---|---|---|---|
| Holder Larry | $175,000 | None Available | |
| Broadie Willie | $135,000 | None Available | |
| Jackson Morris B | $127,000 | None Available | |
| Radford Bruce A | $145,000 | -- |
Source: Public Records
Mortgage History
| Date | Status | Borrower | Loan Amount |
|---|---|---|---|
| Open | Holder Larry | $171,830 | |
| Previous Owner | Jackson Morris B | $100,000 |
Source: Public Records
Tax History
| Year | Tax Paid | Tax Assessment Tax Assessment Total Assessment is a certain percentage of the fair market value that is determined by local assessors to be the total taxable value of land and additions on the property. | Land | Improvement |
|---|---|---|---|---|
| 2025 | $3,023 | $269,890 | $50,000 | $219,890 |
| 2024 | $2,165 | $170,450 | $29,000 | $141,450 |
| 2023 | $2,199 | $170,450 | $29,000 | $141,450 |
| 2022 | $2,267 | $170,450 | $29,000 | $141,450 |
| 2021 | $2,233 | $170,450 | $29,000 | $141,450 |
| 2020 | $2,267 | $170,450 | $29,000 | $141,450 |
| 2019 | $1,776 | $136,640 | $29,000 | $107,640 |
| 2018 | $1,772 | $134,210 | $29,540 | $104,670 |
| 2017 | $1,731 | $134,210 | $29,540 | $104,670 |
| 2016 | $1,731 | $134,210 | $29,540 | $104,670 |
| 2015 | $1,731 | $134,210 | $29,540 | $104,670 |
| 2014 | $1,731 | $134,210 | $29,540 | $104,670 |
Source: Public Records
Map
Nearby Homes
- 207 E Griswold St
- 807 N Pollock St
- 600 E Lizzie St
- 800 E Lizzie St
- 804 E Lizzie St
- 601 Temple St
- 0 N Webb St Unit 749891
- 405 N Sharpe St
- 300 W Amber Oak Dr
- 404 N Massey St
- 401 N Massey St
- 203 N Sellers St Unit A&B
- 406 E Waddell St Unit B
- 183 Noramac Ct
- 1029 N Carolina 39 Hwy
- 5493 N Carolina 39 Hwy
- 201 N Massey St
- 0 Atkinson Mill Rd Unit 10022797
- 301 N Brevard St
- 208 S Webb St
Your Personal Tour Guide
Ask me questions while you tour the home.