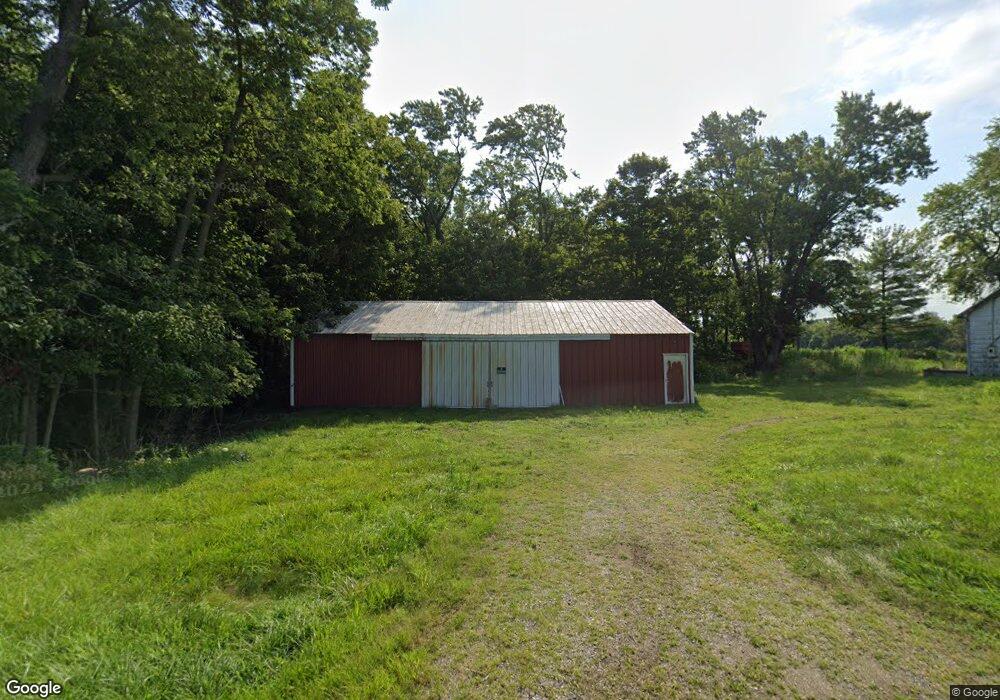
904 Quaker Trace Rd West Alexandria, OH 45381
Estimated Value: $232,000 - $419,000
2
Beds
1
Bath
1,500
Sq Ft
$213/Sq Ft
Est. Value
About This Home
This home is located at 904 Quaker Trace Rd, West Alexandria, OH 45381 and is currently estimated at $320,209, approximately $213 per square foot. 904 Quaker Trace Rd is a home located in Preble County with nearby schools including Twin Valley South Elementary School, Twin Valley South Middle School, and Twin Valley South High School.
Ownership History
Date
Name
Owned For
Owner Type
Purchase Details
Closed on
Oct 12, 2022
Sold by
Schweikert Pamela
Bought by
Krickenbarger Douglas L and Krickenbarger Lisa K
Current Estimated Value
Home Financials for this Owner
Home Financials are based on the most recent Mortgage that was taken out on this home.
Original Mortgage
$272,000
Outstanding Balance
$261,469
Interest Rate
5.89%
Mortgage Type
New Conventional
Estimated Equity
$58,740
Purchase Details
Closed on
May 4, 2022
Sold by
Krickenbarger Family Trust
Bought by
Schweikert Pamela and Lipps Melissa
Purchase Details
Closed on
Feb 24, 2006
Sold by
Krickenbarger Byron F and Krickenbarger Phyllis M
Bought by
Krickenbarger Byron F and Krickenbarger Phyllis M
Purchase Details
Closed on
Jan 1, 1981
Bought by
Krickenbarger Byron F Successor Tru
Create a Home Valuation Report for This Property
The Home Valuation Report is an in-depth analysis detailing your home's value as well as a comparison with similar homes in the area
Home Values in the Area
Average Home Value in this Area
Purchase History
| Date | Buyer | Sale Price | Title Company |
|---|---|---|---|
| Krickenbarger Douglas L | -- | -- | |
| Krickenbarger Douglas L | -- | None Listed On Document | |
| Schweikert Pamela | -- | Dynes &Dynes Llc | |
| Schweikert Pamela | -- | Dynes &Dynes Llc | |
| Krickenbarger Byron F | -- | Attorney | |
| Krickenbarger Byron F Successor Tru | $68,000 | -- |
Source: Public Records
Mortgage History
| Date | Status | Borrower | Loan Amount |
|---|---|---|---|
| Open | Krickenbarger Douglas L | $272,000 | |
| Closed | Krickenbarger Douglas L | $272,000 |
Source: Public Records
Tax History Compared to Growth
Tax History
| Year | Tax Paid | Tax Assessment Tax Assessment Total Assessment is a certain percentage of the fair market value that is determined by local assessors to be the total taxable value of land and additions on the property. | Land | Improvement |
|---|---|---|---|---|
| 2024 | $1,855 | $98,530 | $80,150 | $18,380 |
| 2023 | $1,855 | $98,530 | $80,150 | $18,380 |
| 2022 | $1,248 | $32,220 | $18,640 | $13,580 |
| 2021 | $1,349 | $79,400 | $65,820 | $13,580 |
| 2020 | $1,294 | $79,400 | $65,820 | $13,580 |
| 2019 | $1,618 | $75,740 | $62,680 | $13,060 |
| 2018 | $1,675 | $75,740 | $62,680 | $13,060 |
| 2017 | $1,670 | $75,740 | $62,680 | $13,060 |
| 2016 | $1,772 | $65,120 | $53,460 | $11,660 |
| 2014 | $629 | $65,110 | $53,450 | $11,660 |
| 2013 | $629 | $54,215 | $42,560 | $11,655 |
Source: Public Records
Map
Nearby Homes
- 250 Yost Rd
- 1389 Leon Dr
- 4801 Fisher Twin Rd
- 10 Western Dr
- 99 Katherine Dr
- The Heath House Plan at Meadowbrook Estates
- The Aspen House Plan at Meadowbrook Estates
- The Reed II House Plan at Meadowbrook Estates
- The Rowan House Plan at Meadowbrook Estates
- The Linden House Plan at Meadowbrook Estates
- The Sequoia House Plan at Meadowbrook Estates
- 37 Smith St
- 60 Hope Ave
- 86 Snapdragon Dr
- 1489 Wysong Rd
- 0 U S 35
- 232 Goldenrod Dr
- 124 Wynona Dr
- 36 E 3rd St
- 212 E 3rd St
- 766 Quaker Trace Rd
- 756 Quaker Trace Rd
- 730 Quaker Trace Rd
- 716 Quaker Trace Rd
- 706 Quaker Trace Rd
- 670 Quaker Trace Rd
- 1107 Quaker Trace Rd
- 649 Quaker Trace Rd
- 1156 Quaker Trace Rd
- 1025 Quaker Trace Rd
- 973 Stover Rd
- 511 Quaker Trace Rd
- 495 Quaker Trace Rd
- 430 Quaker Trace Rd
- 931 Stover Rd
- 885 Stover Rd
- 967 Stover Rd
- 427 Quaker Trace Rd
- 975 Stover Rd
- 660 Vanessa Dr