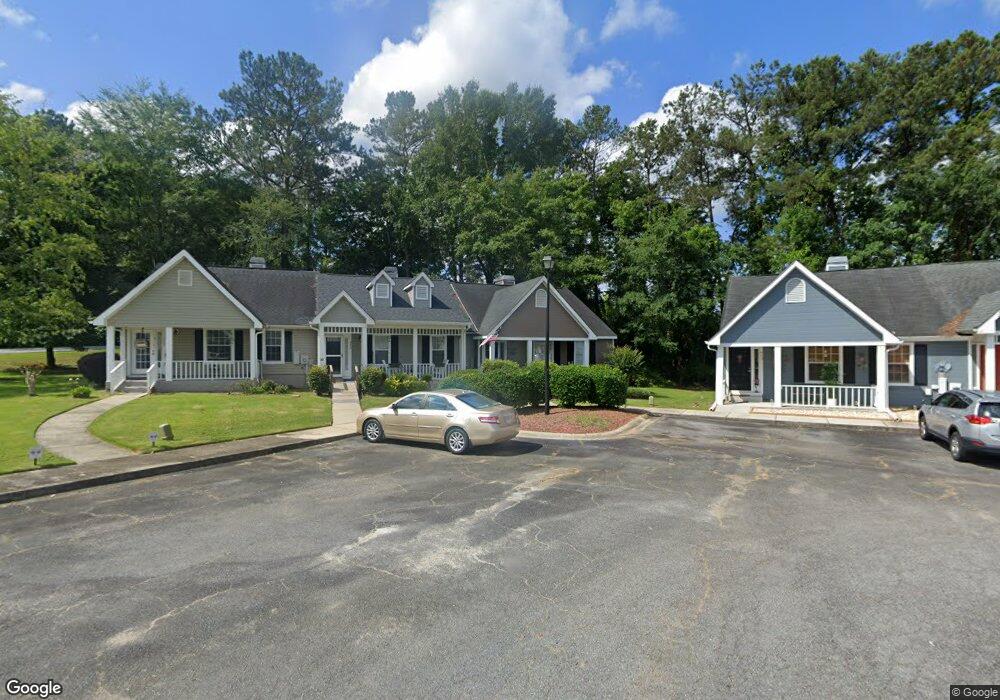
904 Ridge Crest Ct Macon, GA 31204
Estimated Value: $142,000 - $156,000
2
Beds
2
Baths
1,242
Sq Ft
$120/Sq Ft
Est. Value
About This Home
This home is located at 904 Ridge Crest Ct, Macon, GA 31204 and is currently estimated at $149,280, approximately $120 per square foot. 904 Ridge Crest Ct is a home located in Bibb County with nearby schools including Rosa Taylor Elementary School, Howard Middle School, and Howard High School.
Ownership History
Date
Name
Owned For
Owner Type
Purchase Details
Closed on
Jun 9, 2018
Sold by
Robertson Johnny F
Bought by
Hallman Morman R
Current Estimated Value
Purchase Details
Closed on
Apr 10, 2018
Sold by
Hallman Norman R
Bought by
Robertson Johnny F
Purchase Details
Closed on
Sep 18, 2017
Sold by
Misinco Wanda H
Bought by
Hallman Norman Ray
Purchase Details
Closed on
Oct 17, 2011
Sold by
Robertson Johnny F
Bought by
Misinco Wanda H
Purchase Details
Closed on
Sep 28, 2005
Sold by
Cannon Tiffany A and Garrard Tiffany A
Bought by
Robertson Johnny F
Home Financials for this Owner
Home Financials are based on the most recent Mortgage that was taken out on this home.
Original Mortgage
$81,450
Interest Rate
5.77%
Mortgage Type
Future Advance Clause Open End Mortgage
Purchase Details
Closed on
May 31, 2001
Bought by
Robertson Johnny F
Create a Home Valuation Report for This Property
The Home Valuation Report is an in-depth analysis detailing your home's value as well as a comparison with similar homes in the area
Home Values in the Area
Average Home Value in this Area
Purchase History
| Date | Buyer | Sale Price | Title Company |
|---|---|---|---|
| Hallman Morman R | -- | None Available | |
| Robertson Johnny F | -- | None Available | |
| Hallman Norman Ray | -- | None Available | |
| Misinco Wanda H | $69,475 | None Available | |
| Robertson Johnny F | $90,500 | None Available | |
| Robertson Johnny F | $82,200 | -- |
Source: Public Records
Mortgage History
| Date | Status | Borrower | Loan Amount |
|---|---|---|---|
| Previous Owner | Robertson Johnny F | $81,450 |
Source: Public Records
Tax History Compared to Growth
Tax History
| Year | Tax Paid | Tax Assessment Tax Assessment Total Assessment is a certain percentage of the fair market value that is determined by local assessors to be the total taxable value of land and additions on the property. | Land | Improvement |
|---|---|---|---|---|
| 2025 | $991 | $54,890 | $4,000 | $50,890 |
| 2024 | $981 | $53,104 | $4,000 | $49,104 |
| 2023 | $1,015 | $48,640 | $4,000 | $44,640 |
| 2022 | $969 | $41,885 | $4,440 | $37,445 |
| 2021 | $1,232 | $32,430 | $4,000 | $28,430 |
| 2020 | $1,259 | $32,430 | $4,000 | $28,430 |
| 2019 | $1,175 | $30,004 | $4,000 | $26,004 |
| 2018 | $1,979 | $30,004 | $4,000 | $26,004 |
| 2017 | $1,124 | $30,004 | $4,000 | $26,004 |
| 2016 | $1,038 | $30,004 | $4,000 | $26,004 |
| 2015 | $1,469 | $30,004 | $4,000 | $26,004 |
| 2014 | $1,787 | $31,737 | $4,000 | $27,737 |
Source: Public Records
Map
Nearby Homes
- 957 Laurel Oak Ct
- 1017 Clifton Dr
- 954 Greystone Ct
- 1031 Clifton Dr
- 3150 Misty Valley Ct
- 1051 Clairmont Place
- 3077 River Ridge Dr
- 161 Ten Knolls Dr
- 770 Windsor Rd
- 2958 Glenrock Dr
- 2916 Southshore Dr
- 2945 Crestline Dr
- 1246 Newport Rd
- 3500 Northside Dr
- 1068 S Pine Knoll Dr
- 740 Valley Trail
- 1197 Matthews Place
- 3602 Northside Dr
- 880 Winchester Cir
- 3622 Northside Dr
- 902 Ridge Crest Ct
- 910 Ridge Crest Ct
- 900 Ridge Crest Ct
- 900 Ridge Crest Ct Unit 11A
- 912 Ridge Crest Ct
- 914 Ridge Crest Ct
- 916 Ridge Crest Ct
- 918 Ridge Crest Ct
- 918 Ridge Crest Ct Unit 17
- 921 Ridge Crest Ct
- 923 Ridge Crest Ct
- 925 Ridge Crest Ct
- 924 Ridge Crest Ct
- 926 Ridge Crest Ct
- 915 Red Oak Dr
- 928 Ridge Crest Ct
- 933 Ridge Crest Ct
- 944 Hickory Ridge Dr
- 935 Ridge Crest Ct
- 930 Ridge Crest Ct