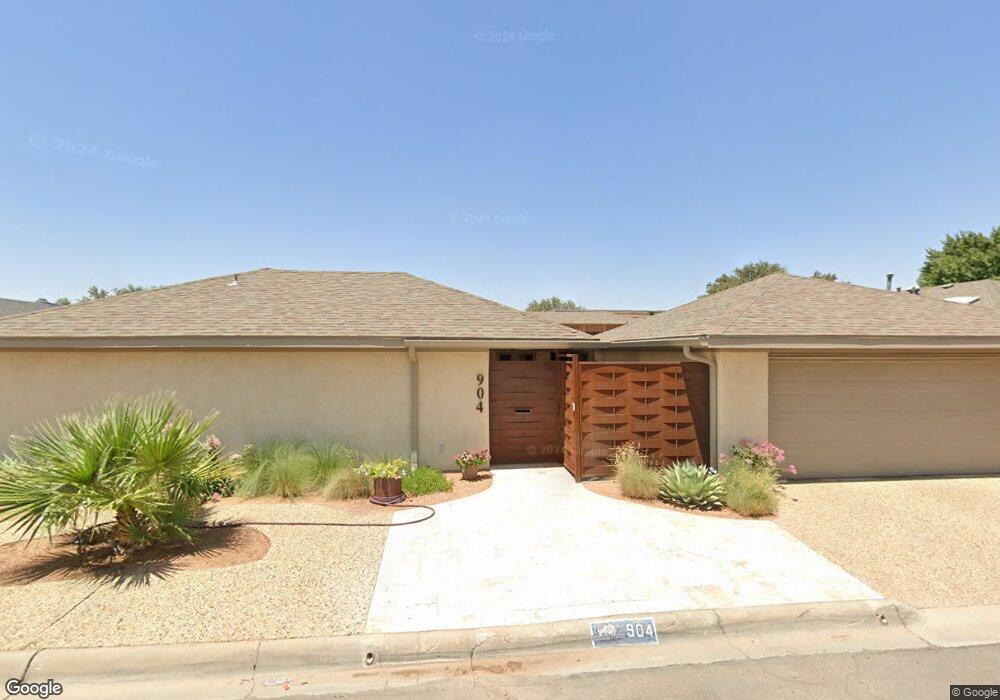
904 Shirley Ct Midland, TX 79705
Estimated Value: $396,000 - $499,000
--
Bed
2
Baths
2,472
Sq Ft
$184/Sq Ft
Est. Value
About This Home
This home is located at 904 Shirley Ct, Midland, TX 79705 and is currently estimated at $453,975, approximately $183 per square foot. 904 Shirley Ct is a home located in Midland County with nearby schools including Fannin Elementary School, Midland High School, and The Hillander School.
Ownership History
Date
Name
Owned For
Owner Type
Purchase Details
Closed on
Oct 16, 2018
Sold by
Adkisson Charles A and Peterson Chantal
Bought by
Carroll John Christopher and Carroll Lorraine Marie
Current Estimated Value
Home Financials for this Owner
Home Financials are based on the most recent Mortgage that was taken out on this home.
Original Mortgage
$320,000
Outstanding Balance
$290,985
Interest Rate
6.85%
Mortgage Type
Adjustable Rate Mortgage/ARM
Estimated Equity
$162,990
Purchase Details
Closed on
Nov 15, 2012
Sold by
Wecker Vera H and Wecker Vera H
Bought by
Adkisson Charles A
Home Financials for this Owner
Home Financials are based on the most recent Mortgage that was taken out on this home.
Original Mortgage
$150,000
Interest Rate
3.37%
Mortgage Type
New Conventional
Purchase Details
Closed on
Jul 1, 1987
Bought by
Adkisson Charles A
Purchase Details
Closed on
Dec 28, 1979
Bought by
Adkisson Charles A
Create a Home Valuation Report for This Property
The Home Valuation Report is an in-depth analysis detailing your home's value as well as a comparison with similar homes in the area
Home Values in the Area
Average Home Value in this Area
Purchase History
| Date | Buyer | Sale Price | Title Company |
|---|---|---|---|
| Carroll John Christopher | -- | Lone Star Abstract & Title C | |
| Adkisson Charles A | -- | West Texas Abstract & Title | |
| Adkisson Charles A | -- | -- | |
| Adkisson Charles A | -- | -- |
Source: Public Records
Mortgage History
| Date | Status | Borrower | Loan Amount |
|---|---|---|---|
| Open | Carroll John Christopher | $320,000 | |
| Previous Owner | Adkisson Charles A | $150,000 |
Source: Public Records
Tax History Compared to Growth
Tax History
| Year | Tax Paid | Tax Assessment Tax Assessment Total Assessment is a certain percentage of the fair market value that is determined by local assessors to be the total taxable value of land and additions on the property. | Land | Improvement |
|---|---|---|---|---|
| 2025 | $5,451 | $431,580 | $16,970 | $414,610 |
| 2024 | $5,460 | $444,140 | $16,970 | $427,170 |
| 2023 | $5,135 | $435,870 | $16,970 | $418,900 |
| 2022 | $6,068 | $388,350 | $16,970 | $371,380 |
| 2021 | $6,690 | $383,980 | $16,970 | $367,010 |
| 2020 | $5,802 | $378,710 | $16,970 | $361,740 |
| 2019 | $7,170 | $378,710 | $16,970 | $361,740 |
| 2018 | $5,485 | $282,110 | $16,970 | $265,140 |
| 2017 | $5,160 | $265,370 | $16,970 | $248,400 |
| 2016 | $4,889 | $259,000 | $16,970 | $242,030 |
| 2015 | -- | $259,000 | $16,970 | $242,030 |
| 2014 | -- | $253,880 | $16,970 | $236,910 |
Source: Public Records
Map
Nearby Homes
- 907 Shirley Ct
- 806 Stanolind Ave
- 1209 W Pecan Ave
- 2202 Western Dr
- 2105 Oaklawn Dr
- 2109 Western Dr
- 6 Lafayette Place
- 716 Melton Alley
- 705 Melton Alley
- 7 Lafayette Place
- 1000 Sinclair Ave
- 1200 W Scharbauer Dr
- 809 Sinclair Ave
- 1202 W Scharbauer Dr
- 1210 W Scharbauer Dr
- 1805 N D St
- 800 Other Ave
- 1611 W Pecan Ave
- TBD Bonham St
- 501 W Scharbauer Dr Unit 28